Wednesday, January 25, 2012

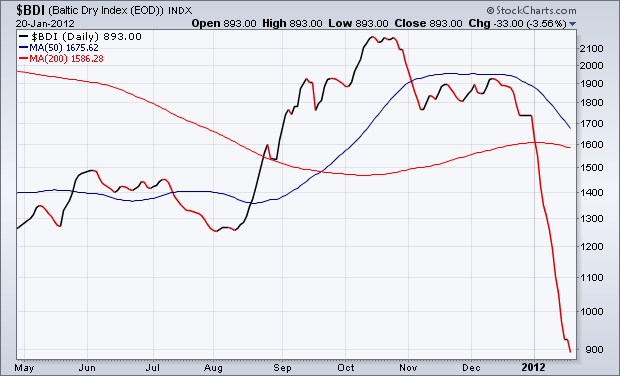
Baltic Dry Index – Sell-Off Overdone?
Source: StockCharts.com
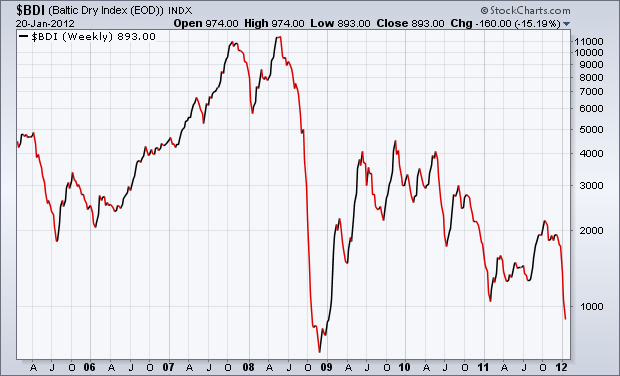
The Baltic Dry Index is generally viewed as a leading indicator of global economic activity as dry bulk primarily consists of commodities such as building materials, coal, metallic ores and grain. The massive growth in demand for commodities from 2005 to 2008 led to a surge in shipping rates as measured by the Baltic Dry Index. The demand and surging shipping rates subsequently resulted in a significant increase in capacity as the number of ships built increased sharply. Even during the great 2008/2009 crisis capacity continued to be increased as it takes two years to build a ship. Historically the capacity was generally tight and the supply seen as inelastic, resulting in marginal changes in demand causing rapid changes in shipping rates. The current significant surplus capacity in the industry means that supply exceeds potential demand to such an extent that supply elasticity has increased, resulting in rapid changes occurring in what is essentially a downtrend – yes, fundamentally the Baltic Dry Index is in a bear market as shown by the long-term chart below.
Source: StockCharts.com
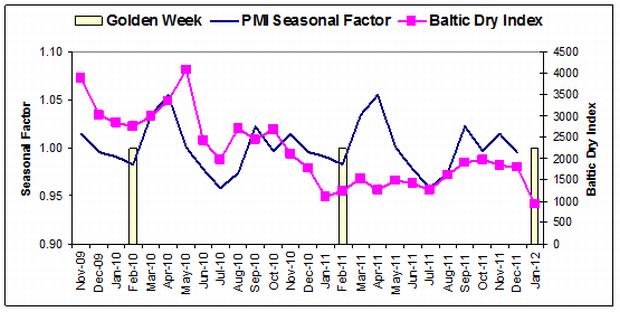
But what causes the rapid changes in demand and therefore the Baltic Dry Index? My research indicates that global manufacturing demand has very little to do with it. The answer is Chinese manufacturing demand but not the actual level of manufacturing measured by the CFLP Manufacturing PMI. In previous articles I referred to the CFLP Manufacturing PMI that is supposed to be seasonally adjusted. Despite the seasonal adjustment, a seasonal trend is clearly evident and I therefore seasonally adjusted the series further. I was amazed to find that the monthly seasonal factors and the Baltic Dry Index track each other. The reason why is not hard to find, as China is by far the world’s biggest consumer and importer of commodities and therefore the biggest player in dry bulk. Seasonally weak periods in the economy will lead to low physical demand for commodities and therefore low freight demand. On the other hand, strong periods in the economy will lead to high freight demand.
In the graph below I depicted my calculated PMI seasonal factor against the Baltic Dry Index. I have also indicated China’s New Year’s Golden Week holiday on the chart as it coincides with and explains the reasons for the weak seasonal pattern in January/February. The impact on China’s manufacturing sector is massive as the New Year’s Golden Week lasts for 15 days and includes three public holidays, while factory workers are allowed to take Sundays off. This year New Year will be celebrated on January 23, and the festival will last until February 6. The onset of the festive season/weak seasonal patch is therefore the reason behind the tumble in the Baltic Dry Index.
Sources: CFLP; Li & Fung; I-Net Bridge; Plexus Asset Management,
January/February could also mean a seasonal low for the Baltic Dry Index as from a seasonal perspective March and April are the strongest months in China’s manufacturing sector. In March and April last year the Baltic Dry Index failed to rise rapidly due to Japan’s twin disasters in March that severely restricted trade between China and Japan.
Notorious Market Timer Joe Granville Predicts A 50% Plunge
Notorious market timer Joe Granville predicted a 50% market plunge yesterday on Bloomberg Television:
Joseph Granville, whose “sell everything” call in 1981 sparked a decline in U.S. stocks, said the Dow Jones Industrial Average (INDU) will drop toward 8,000 this year because of waning momentum and volume.
“Volume precedes prices,” Granville, 88, a technical analyst who has been publishing the Granville Market Letter from Kansas City, Missouri for about 50 years, said in an interview on “Street Smart” on Bloomberg Television. “You are seeing much lower volume. That tells you that prices are going to go much lower, much lower than most people think possible and very few people have projected.”
Art Cashin noted the significance of Granville's call (via Zero Hedge):
Calamity Joe Is Back - Last week, we wrote that various cycles and technicians were pointing to a possible market top, on or about January 23rd. The “causes” ranged from sophisticated oscillators to the new moon to astrological confluences. Yesterday, one more “cause” was added and it came from a somewhat controversial Wall Street legend - Joe Granville.
Here's the video:
Production Cut Spells Profits for Apache : APA
Apache Corp. (NYSE:APA) — This independent energy company, which explores for, develops and produces natural gas, crude oil and natural gas liquids, has been in a bear market since August, when it broke down from its 200-day moving average at $120.
On Oct. 5, with the stock at $79, the Trade of the Day recommended buying APA following a positive signal from our proprietary indicator, the Collins-Bollinger Reversal (CBR), for a trade to $90.
The trade was successful and the stock is now recommended for a longer-term move higher following the break from a base at its 50-day moving average (blue line).
Chesapeake Energy (NYSE:CHK) announced yesterday that it will cut natural gas production by 8%, which should result in higher gas prices that would benefit APA.
Initially the stock should trade up to its 200-day moving average at over $105, but S&P has a “five-star strong buy” on APA with a 12-month target of $145.

Where to Find Good Value in Europe (Koesterich)
by Russ Koesterich, Chief Investment Strategist, iShares
Call #1: An Update on Europe & Overweight Norway
While there have been developments toward solving the European debt crisis in recent months, more needs to be done.
Funding costs for Italy and Spain remain high, particularly for Italy. It also looks more likely that at some point in the next year or two Greece will need to default and potentially leave the euro zone. Europe also has yet to definitively address the fiscal and growth problems in the peripheral countries.
With the European crisis dragging on and Europe likely to experience at least a mild recession this year, stocks in the region have become very cheap — the Euro Stoxx Index is trading at 8.3 next year’s earnings. I still, however, continue to be cautious on the region overall and advocate avoiding large parts of Europe – particularly Spain and Italy. These markets are cheap for a reason.
Still, I do like some countries in the economically stable northern region of the continent. Much of Northern Europe arguably represents a good value for long-term investors when you consider these countries’ current valuations, growth prospects and perceived risk. I’m reiterating my overweight views of Germany and the Netherlands, and I’m also now advocating an overweight position in Norwegian equities.
From a valuation perspective, you can buy global large caps in Northern Europe for virtually the same price as the more fundamentally challenged companies in southern Europe. Stocks in Germany’s DAX index, for instance, currently trade at less than 9x next year’s earnings, while equities in Norway and in the Netherlands are trading at just 8.5x next year’s earnings.
Meanwhile, countries in Northern Europe, particularly the Nordic countries, are generally expected to grow faster than other developed markets. Based on International Monetary Fund forecasts, Sweden, Finland and Norway should post economic growth this year well above the developed market average.
Finally, based on current credit default swap spreads, these countries are perceived as less risky than the problem children further to the south. This is largely due to Northern Europe’s very modest debt burdens (potential iShares solutions: EWG, EWN).
Source: Bloomberg
Chart of the Day - J.M. Smucker Company (SJM)
The "Chart of the Day" is J.M. Smucker Company (SJM), which showed up on Monday's Barchart "All Time High" list. Smucker on Monday posted a new all-time high of $81.25 and closed up 0.85%. TrendSpotter has been Long since Dec 20 at $78.39. In recent news on the stock, JP Morgan on Nov 18 added Smucker to its Focus List and reiterated its Overweight rating. Barron's on Nov 18 ran a favorable article on Smucker, saying the company should benefit from recent price increases and that its brands should give it leverage with retailers and resonate with consumers as the economy improves. J.M. Smucker Company, with a market cap of $9 billion, is the leading marketer of jams, jellies, preserves, and other fruit spreads in the U.S.

Tuesday, January 24, 2012
Is This the End of the Road for the Rally?
The “dumb money” indicator has become extremely bullish (bear signal), and this is what one would expect with rising prices. The higher prices go the more bulls that are recruited. But is it the end of the road for the rally? Not necessarily so. In 1995, 2003, 2009, and Q4 2010/Q1 2011 we saw the phenomenon that I have dubbed “it takes bulls to make a bull market”. It is a market characterized by rising prices and excessive bullishness. In the case of 1995, 2003, 2009, the excessive bullishness and multi-month rally seem to be warranted as the markets were bouncing back from steep losses or a prolong period of consolidation (1995). The Q4 2010/ Q1 2011 version of this phenomenon was a QE2 induced feeding frenzy. With investors taking their cues from the Federal Reserve and European Central Bank, the current market environment resembles Q4 2010/ Q1 2011. For now, we need to respect this dynamic as we could be witnessing another melt up. The bulls have the ball in their court and are on the cusp of turning this recent price move into a multi-month barn burner.
The “Dumb Money” indicator (see figure 1) looks for extremes in the data from 4 different groups of investors who historically have been wrong on the market: 1) Investors Intelligence; 2) MarketVane; 3) American Association of Individual Investors; and 4) the put call ratio. This indicator shows extreme bullishness.
Figure 1. “Dumb Money”/ weekly

Figure 2 is a weekly chart of the SP500 with the InsiderScore “entire market” value in the lower panel. From the InsiderScore weekly report: “Insider trading volume was seasonally thin last week, the result of most insiders being locked-up and prohibited from trading until after their companies’ Q4’11 earnings announcements, as well as the market holiday.”
Figure 2. InsiderScore “Entire Market” value/ weekly

Figure 3 is a weekly chart of the SP500. The indicator in the lower panel measures all the assets in the Rydex bullish oriented equity funds divided by the sum of assets in the bullish oriented equity funds plus the assets in the bearish oriented equity funds. When the indicator is green, the value is low and there is fear in the market; this is where market bottoms are forged. When the indicator is red, there is complacency in the market. There are too many bulls and this is when market advances stall. Currently, the value of the indicator is 65.09%. Values less than 50% are associated with market bottoms. Values greater than 58% are associated with market tops.
Figure 3. Rydex Total Bull v. Total Bear/ weekly

Let me also remind readers that we are offering a one-month free trial to our Daily Sentiment Report, which focuses on daily market sentiment and the Rydex asset data. This is excellent data based upon real assets and not opinions.
Dow Jones Never Loss Trade
Incredible Dow Jones Secret - No Loss!