Friday, June 3, 2011

Comex Silver Bullion Default on Sharp 38% Drop in Inventories

Spot gold and silver prices rose slightly again this morning after hitting a one-month high yesterday as equity markets internationally came under selling pressure. The Moody's downgrade of Greece and worryingly poor US economic data again pushed investors to seek the safe haven of bullion. Gold reached new record nominal highs in sterling yesterday (£945.62/oz) as the pound fell on concerns about the UK economy.
Silver Prices and Rates
Markets await key U.S. data on non-farm payrolls on Friday, while ongoing concerns over Greek sovereign debt and contagion in the Eurozone also affected market sentiment and supported the precious metals.
COMEX Silver Bullion Registered Inventories – January 1996 to May 31st 2011
Friday's U.S. payrolls is likely to show that the world's largest economy is weakening and may be on the verge of a double dip which will likely lead to further safe haven demand.
Seeing as the extent of the recovery was always exaggerated, this is not a surprise to us.
The supply situation in the silver market gets more interesting by the day.
Registered COMEX silver inventories have fallen to multiyear lows at 29,631,268 ounces. In the last 5 days they fell from 32,132,903 ounces to Tuesday’s holdings of 29,631,268 ounces. As can be seen in the table below registered silver inventories fell every single day last week leading to a sharp fall of 8.4% in 5 days.
Registered metals are those metals which meet the standards for delivery under the silver futures contracts and for which a receipt from an Exchange-approved depository or warehouse has been issued. Eligible metals are those which meet the delivery standards as stated in the rules for which no receipt from an Exchange-approved warehouse has been issued.
This is a long term trend that has been seen since the early 1990s when total COMEX silver stockpiles were over 101.45 million ounces.
However, the scale of the drop in inventories since early 2008 is significant and the trend has accelerated in recent weeks.
Registered silver inventories are down a sharp 38.5% in just two weeks – from 41,044,280 to 29,631,268.
COMEX Silver Bullion Registered Inventories – June 2009 to May 31st 2011
The record nominal highs near $50/oz, seen 31 years ago and again at the end of April, are likely to be seen again sooner rather than later due to the increasingly delicate supply demand balance.
The scale of current investment demand and industrial demand, especially from China and the rest of Asia, is such that it is important to keep monitoring COMEX warehouse stocks.
The Hunt Brothers were one of a few dozen billionaires in the world in the late 1970s when they attempted to corner the market. Today there are thousands of billionaires in the world, any number of whom could again attempt to corner the silver market.
Also, today unlike in the 1970s, there are sovereign wealth funds and hundreds of hedge funds with access to billions in capital.
COMEX Silver Bullion Stockpiles – 05/31/11
The possibility of an attempted cornering of the silver market through buying and taking delivery of physical bullion remains real. However it would be very difficult to corner the silver market due to the very small nature of the silver bullion market.
A COMEX default remains a risk as does a massive short squeeze which could see silver surge as it did in the 1970s and again recently leading to silver targeting the inflation adjusted record high of $140/oz.
As ever price predictions from gurus should be take with a pinch of salt and diversification remains of paramount importance. 

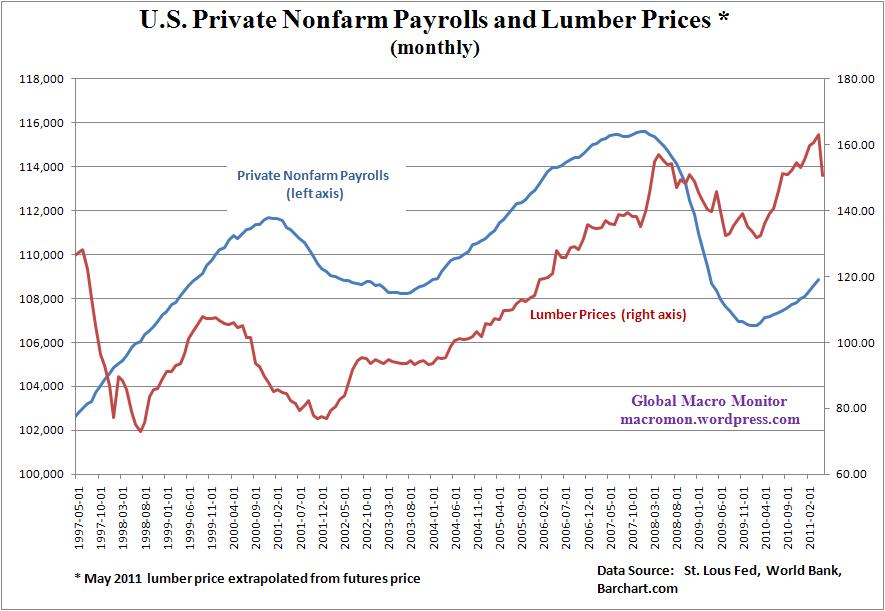
Lumber Prices: Leading Indicator for Private Nonfarm Payrolls?

In the chart below we take a look at the relationship between lumber prices and private nonfarm payrolls.   Clearly they tend to move together on a monthly basis.  One of the transmission mechanisms of monetary policy is the impact of interest rate changes on the  construction sector, which has historically been a leader of past economic recoveries.
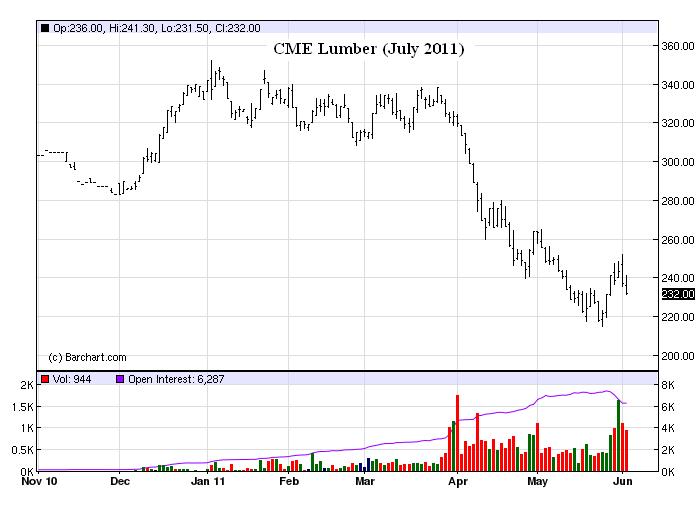
This is clearly not the case in the current balance sheet growth recession, so we are not as confident in the lumber price/nonfarm payroll relationship.   Nevertheless,  lumber futures have been under heavy pressure since the end of March,  down over 30 percent,  no doubt, partially the result of the double dip in housing prices.    It will interesting to see how, or if, the correction in lumber shows up in the private nonfarm payroll number tomorrow.
~~~

10 Reasons Why The “Economic Recovery” Is a Fraud

Americans have been continually deceived about the true state of the financial system
10 Reasons Why The “Economic Recovery” Is a Fraud 020611top2
Paul Joseph Watson
Prison Planet.com
Thursday, June 2, 2011
Yesterday’s so-called “horror” show for the US economy with the release of new data illustrating how the economic “recovery” has all but ground to a halt was met with feigned astonishment and shock by the establishment media, and yet for the past two years the public has been continually deceived about the true state of the financial system.
All the hot air about an “economic recovery” has served to hide the fact that the United States is slipping back into a double-dip recession, if not a second “great depression,” as market strategist Peter Yastrow told CNBC yesterday.
1) In 2009, when the media claimed the economic “recovery” had begun, oil prices averaged $54 dollars a barrel. In the 24 months since, the cost has doubled. Americans are paying more and more to fill up at the pump with Goldman Sachs predicting that gas will hit $5 dollars a gallon by summer. This figure was already reached in Washington DC two months ago. Far from representing a “recovery” this is in fact another crippling expense that many Americans people simply cannot afford.
2) The housing market has shown no “recovery” whatsoever. The collapse in US house prices “is now greater than that suffered during the Great Depression.” Prices have plunged by 33 per cent since 2007. Home ownership is at its lowest level for 20 years.
3) The collapse in home ownership has flooded the rental market, leading to massive inflation “pushing up the cost of leases across the nation’s 38 million rented residences,” reports Bloomberg. Far from enjoying a “recovery,” US citizens lucky enough not to be stuck in underwater mortgages are instead paying through the nose for rental inflation that represents a huge chunk of the overall consumer price index.
4) Food price inflation is also savaging Americans who are being browbeaten by the word “recovery” while the cost of their groceries soars to unaffordable levels, forcing them to buy cheap unhealthy GMO crap or simply go hungry. Food prices in the US are climbing at the fastest rate since the 1970′s.
5) While Americans were being told to jump on the “recovery” bandwagon and spend more money to reinvigorate the economy, their median incomes were plummeting. Americans are getting poorer. According to the U.S. Census Bureau, median household income in the United States fell from $51,726 in 2008 to $50,221 in 2009 and has been flat since, even as the cost of living continues to rise.
6) While the Federal Reserve points to GDP growth as evidence of recovery, citing figures of $700 million in growth from 2008-2011, the government had to borrow and spend $5.1 trillion just to attain that level. “The Federal government borrowed and spent $5.1 trillion over the past four years to generate a cumulative $700 billion increase in the nation’s GDP. That means we’ve borrowed and spent $7.28 for every $1 of nominal “growth” in GDP,” writes Charles Hugh Smith.
7) While the establishment media and the government pretends that US unemployment numbers are on the decline, the real unemployment figure stands at over 22 per cent. An even more alarming figure shows that fewer than 46 per cent of Americans actually have jobs, with employment rates in California and Arizona hovering around 37 per cent.
8) Along with almost all paper currencies, the dollar has drastically declined in comparison to commodities like gold and silver since the so-called “recovery” began in 2009. At the bottom of the economic slump in the middle of 2009, the greenback was hovering around the $950 dollar an ounce level – it is now well above $1500 and only soaring higher. A weakening dollar reduces Americans’ buying power and makes them pay more for staple necessities like food and fuel as the cost of living skyrockets.
9) Far from staging a “recovery,” US consumer confidence is now lower than during all the financial crises or tragedies of the last several decades. From the crash of ’87, to Enron, to 9/11, to the collapse of Lehman Brothers in 2008, Americans have never been so pessimistic about the economy.
10) Of course, the only people enjoying a financial “recovery” are the Wall Street bankers and the financial terrorists who pulled the plug on the economy in the first place. Since its 2009 low of 7062, the Dow Jones Industrial Average has gained by almost 6,000 points. This means little to the average American that can barely afford to put food on the table, never mind invest in the stock market.

Goldman Sachs Hit With Subpoena From Manhattan DA: Will Wall St. Fat Cats Face Jail For '08 Crisis?

Investment banking giant Goldman Sachs is facing a criminal probe for its role in the credit collapse of 2008.
Manhattan District Attorney Cy Vance Jr.
Julia Xanthos/News
Manhattan District Attorney Cy Vance Jr.
 Manhattan District Attorney Cy Vance has a fat new target: Wall Street titan Goldman Sachs, which got hit with a subpoena into its actions right before the 2008 credit collapse.
The subpoena stems from a scathing 639-page Senate report accusing Goldman of deliberately selling toxic mortgage-backed securities to unsuspecting clients, knowing the housing market was about to crash.
Vance's office would not comment, but a law enforcement source confirmed a Bloomberg News report about the subpoena.
Nearly three years after the bottom fell out of the housing market, sending the economy spinning into the worst recession since the 1930s, not one Wall Street fat cat has gone to jail - even as evidence mounts that many knew their complicated mortgage-related deals were garbage.
Critics complain that the rich bankers who torched the economy are being treated as "too big to jail."
But there has been a growing move to go after the big banks that survived the crisis - especially the 142-year-old Goldman Sachs.
Last year, the SEC accused Goldman of defrauding investors of more than $1 billion by talking up complex subprime mortgage-related securities that it knew were toxic, then betting against those funds and profiting when they tanked.
Goldman settled that case for $550 million.
A Goldman spokesman said the firm would cooperate fully with Vance's investigation.
It is the Manhattan DA's first big foray into white-collar crime, which was the bread and butter of his venerable predecessor, Robert Morgenthau.
Vance has had some high-profile losses, including last month's decision by a Manhattan jury to acquit two cops charged with rape.

Thursday, June 2, 2011

Gold and Silver Form Promising Bullish Divergences

Bull markets do not move in a straight line, nor do the price of gold and silver.  Their price advances, and then retreats to ‘correct’ the previous advance. For the past four weeks, gold and silver have been going through one of these periodic price corrections.   
During these corrections, underlying support is tested.  If support holds, precious metal prices eventually climb higher, putting in the rear-view mirror the prices reached during the test of support as well as the correction itself.
This pattern of ebb-and-flow has recurred time and again over the past ten years, during which time both gold and silver have achieved spectacular price appreciation.  Some corrections have been long and deep, like the one that occurred after the Lehman Brothers collapse.  Others though have been short and shallow.  But they all have one common characteristic. 
The depth and length of a correction cannot be predicted.  All we market participants can do is let the correction run its course, while continuing to accumulate the precious metals as part of our ongoing accumulation plan to cost-average our purchases.
Although the severity of a correction cannot be predicted, there are clues that sometimes give an indication that a correction is ending.  One of these is called a “bullish divergence”.  Importantly, gold and silver have formed promising bullish divergences.
To explain this point, gold and silver prices normally move in synch.  Both advance, or both decline.  What is of interest is when one metal moves in one direction to achieve a new price, while the other metal does not confirm.  So for example, if gold makes a new high and silver does not confirm with its own new high, a bearish divergence has formed, signaling that a price advance may be ending and a correction may be starting. 
Conversely, when one metal makes a new correction low and the other one does not confirm, a bullish divergence has formed.  It is an indication that a correction is ending. 
The bullish divergences gold and silver have formed over the past four weeks can be seen by comparing the following two charts, which present the daily high, low and closing price of gold and silver over the past several months.  The dotted horizontal line marks Friday’s closing price.
Several observations can be made about the above charts:
1) From their late January low, both metals moved higher together more or less in synch.
2) Both gold and silver began their correction on the same day.  In the initial drop, gold made its low on May 5th, but silver kept falling and made its initial low one day later on May 6th.  It was a small bullish divergence because gold did not confirm the new low in silver, and both metals subsequently bounced higher.
3) The precious metals then re-tested their previous low.  Silver fell to a new low in the setback on May 12th, but gold did not confirm.  This was a second bullish divergence, and more meaningful than the first one a few days earlier for the simple reason that gold’s initial low price was still holding firm and had not been broken.
4) Then the precious metals again re-tested their lows a few days later.  On May 17th gold broke below its May 12th low but not the low of May 5th, which has held throughout the correction.  Silver broke below its May 6th low, but not the low reached on May 12th.  It was the third bullish divergence, and this testing and re-testing of support in effect indicated that support at those price levels was solid.  Both gold and silver again bounced higher, and their price rally continues as I write.
So gold and silver have formed what promise to be important bullish divergences signaling that the correction may have run its course.  Here’s another way to look at what has happened.  The selling in a precious metals correction can be compared to a prize-fighter at the end of a tiring bout.  He is punched-out, and can hardly fight anymore.  A divergence says the same thing.  In effect, the downside momentum has ended because the sellers no longer have any ‘punch’ left.
There is one other item worth noting in the above charts, and it too is bullish.  Look at the depth of the correction in silver compared to that of gold.  Silver retraced more than half its gain from the January low, but gold hardly retraced any.  What’s more, gold is now just a chip-shot away from making a new record high.  This relative performance is itself an important bullish divergence.
So taking it all together, there are clear signals that the correction in the precious has ended.  In other words, the low in gold and silver reached earlier this month marks the bottom of the correction.   There may be more testing of support around $1500 and $35, which would not be unusual.  There may even be more bullish divergences.  But look favorably at the bullish divergences already formed because they in essence are saying that the correction may be ending, and more to the point, that the long-term bull market in the precious metals remains intact.
Lastly, the eagle-eyes among you may have noticed the bearish divergence on the above charts.  Gold made a new high on Friday, April 29th, but silver did not confirm.  A nasty correction began the following week.
In summary, spotting divergences is a worthwhile endeavor.  Like everything else when it comes to markets, divergences are not foolproof.  But they are a useful analytical technique that everyone can use to help keep their eye on price trends in a bull market.

Schiff Report: Markets Swoon on Double Dip Fears

Strategic Put Selling - Investment Ideas

One of my favorite strategies for making money off of your favorites stocks is the short or "naked" put, sometimes called "cash-secured" by brokers because they will require a certain percentage of your account capital to be used as margin to cover the potential event of assignment. When you sell a naked put, you are obligated to buy 100 shares of the underlying at the strike price if the stock falls below it come options expiration.
Yesterday I suggested investors should be looking for such opportunities as we enter the summer doldrums and a seasonally-weak period for the market. I named Suncor (SU), Eaton (ETN), and Freeport McMoRan (FCX) as possible candidates in three different cyclical sectors. These are all Zacks #3 Rank or higher stocks and if you are interested in buying them on a pullback, selling a cash-secured put is one great way to do that.
For instance, let's say that you like Freeport and would consider buying it near chart support at $48. If you sold the July 48 put for $2.00, you would be obligated to buy the stock at $48 if shares fall below that strike price before July expiration and you are assigned. But in this case, since you received a $2 premium as a credit for selling the put, your effective buy price for the stock becomes $46.
What if FCX ends above $48 at expiration? You keep the entire option credit, less commissions of course. That's how you generate income on stocks you wouldn't mind buying anyway. You can roughly calculate your rate of return here by using $4,600 as a conservative margin estimate. With 44 days until July expiration, that would give you about a 4.3% return in just over six weeks. Not bad for a stock you wanted to buy "at a discount" anyway.
I say "at a discount" because with FCX currently trading around $49.50 as I write, this strategy allowed you to pinpoint the below-market price you wanted to buy the shares for. What's more, you have several combinations of strike and expiration to custom tailor the strategy to your risk-reward preferences. You could go out to January options and down to the 45 strike, which you might be able to sell for $5 if the stock drops another dollar or so. That would give you an effective buy price for the shares near $40.
In this case, you have taken on more time risk, but you also received a bigger up front option premium for that risk. That's the nature of selling puts, so consider yourself in the insurance business when you do so. You are providing liquidity and insurance to those currently hedging their FCX positions. For full details on the obligations and risks of selling puts, be sure to talk to your broker and ask them for educational resources like the PDF booklet "Characteristics and Risks of Standardized Options," published by The Options Clearing Corporation.
The main thing to keep in mind is to treat the short put strategy as an investment in the stock. Think and act as if you plan to buy the stock at the strike price, less the credit received, and you will have the right frame of mind because the strategy carries all the risks of being long stock. And a great time to implement the strategy is when the market is in a fear-driven move where the prices of options are rising to do a spike in implied volatility, much the way the VIX rises during sell-offs.
I'll revisit this strategy many times over the coming months as I expect a sideways-to-lower environment for stocks. We should get some good opportunities to either generate income on our favorite names or simply buy them "on sale." That's using puts strategically to increase your returns and target pre-determined entry points with an overall more efficient use of trading capital. And, when used on high quality stocks from the Zacks Rank stock rating system, that's smart investing when the rest of the world is running for cover.
Kevin Cook is a Senior Stock Strategist for Zacks.com