Tuesday, May 10, 2011

This new ETF could be one of the few set to surge higher now

When you look at the profusion of new ETF’s being launched today, you find that they almost always correspond with market tops. The higher the market, the greater the demand for the underlying, and the more leverage traders bay for it. The resulting returns for investors are disastrous.

But occasionally a blind squirrel finds an acorn, and if you fire buckshot long enough, you hit a barn. That was the case a year ago when the corn ETF was launched (CORN), after five months of stagnant performance by the grain. I smelled a bargain for my readers, piled them into the ETF the day it launched, and caught a quick double in six weeks, just as the Russian fires were igniting.

I think that we are about to see a replay with the new ProShares Short High Yield ETF (SJB). After riding the bull move in junk all the way up with (JNK), I have recently turned negative on the sector. Junk bonds have moved too far too fast. Current spreads for junk paper are now only 400 basis points over equivalent term Treasury bonds, and investors at these levels are in no way being compensated for their risk.

If the stock market starts to roll over this summer, as I expect, then the junk bond market will follow it in the elevator going to down to the ladies underwear department in the basement. Keep in mind that when shorting the junk market, you run into the same problem you have with the (TBT), a leveraged short ETF for the Treasury bond market. Buy the (SJB) and you are short an 8% coupon, which works out to a monthly costs of 75 basis points. That is a big nut to cover. So timing for entry into this fund will be crucial.

SJB

CORN


JNK

By. Mad Hedge Fund Trader

John Thomas, The Mad Hedge Fund Trader is one of today's most successful Hedge Fund Managers and a 40 year veteran of the financial markets. He has one of the best performing newsletters and has just launched a new investment service for Investors and Traders.

Mark Mobius on frontier markets


A recent Q&A with Mark Mobius, Templeton Asset Management’s emerging markets guru, follows below, courtesy of the company’s monthly newsletter.

What are frontier markets?

Frontier markets are commonly used to describe a subset of emerging markets which have lower market capitalization and liquidity than the more developed emerging markets. More importantly they are markets that have not yet been “discovered” by the majority of investors. They are markets where there is limited research available to investors.

Frontier markets may generally be smaller and less developed than emerging markets, but they continue to experience strong economic growth and maintain a low debt-to-GDP ratio. They are where many emerging markets were 20 years ago. In the future, we expect these markets – at least some of them – to become quite important and to eventually become full-fledged emerging markets.

What is your rationale for investing in them and what’s the essence of your investment strategy?

Economic growth in many frontier market countries remains high and is even faster than some emerging markets and exceeds the growth in developed markets by a wide margin. The growth is not only economic growth but also growth in capital markets. Some of these markets are moving from small and illiquid status to large and liquid.

Many frontier countries are also leading producers of oil, gas and precious metals, and they are well positioned to benefit from the high global demand for these resources. Additionally, as the economies of frontier market countries expand, they continue to increase investments in infrastructure, offering valuable opportunities in the construction, transportation, banking and finance and telecommunications industries. Rising consumption provides these economies with strong purchasing power and the ability to spend their way into growth. Moreover, frontier market countries have been, and continue to be, positively impacted by the substantial investments made by large emerging market countries such as China, India, Russia and Brazil.

The economic drivers across frontier markets are diverse. For example, Botswana, one of the world’s largest diamond exporters, is introducing call and data processing centers. On the other hand, Kazakhstan, a country rich in oil and other natural resources, is seeing significant investments in infrastructure development. These varied economic themes across frontier markets ensure a diversified portfolio.

And why should investors care about frontier markets? Aren’t emerging markets already “risky” enough?

Frontier markets are actually not more risky than emerging markets or developed markets. Although there are a lot of uncertainties because of the general lack of knowledge among investors who don’t have the resources to study those markets, the actual risks are not significantly different from other markets. Although individual markets can be volatile, combined in a diversified portfolio they could be less volatile than a portfolio of developed market stocks.

How does the disaster in Japan (and potential slower growth from Japan), as well as the turmoil in Middle East, factor in one’s analysis of frontier markets?

The Japan and Middle East situations are not having any more impact on frontier markets than any other markets around the world. Of course, in the case of some of the Middle East markets there has been some volatility. However, the wide range of frontier markets going from places like Nigeria, to Vietnam and Ukraine means that events in, say, Egypt, will not have much impact on the other markets.

In fact, we continue to invest in Middle East companies that we believe will survive the current turmoil and prosper over the next five years. Generally speaking the “information revolution” where people of all walks of live and in every economic status can communicate quickly and efficiently with cell phone and through the internet means that it will be more and more difficult for corrupt and dictatorial regimes to survive. This is quite beneficial for the development of capital markets and particularly stock markets so we are quite optimistic regarding the Middle East. Emerging markets growth rates and per capita income are moving up at a rapid pace. As foreign reserves in these countries reach sky-high levels, and their safety profile continues to improve, perceptions about emerging markets also continue to improve. People are beginning to realize they’re not as risky as they seem. Moreover, there’s quite a lot of value in emerging markets, because earnings growth is keeping up at a rapid pace, so we still are finding opportunities.

Do events such as the instability in the MENA region make “investing” during these volatile times more attractive? Or simply more dangerous?

If you have good research on the frontier market companies, volatility can be very good since with panic selling prices can come down temporarily to very low levels enabling the patient and knowledgeable investors buy stocks cheaply.

What are the challenges of investing in frontier markets and how do you try to circumvent them?

While frontier markets offer a potentially attractive investment opportunity, an array of challenges also exists. Examples include poor information flow, illiquid stocks and sudden government policy changes. Frontier markets are subject to additional, heightened risks due to a lack of established legal, political, business and social frameworks to support securities markets. Relying on seasoned international fund managers who have demonstrated knowledge in navigating through these relatively new and volatile markets is essential.

Our emerging markets team has over 40 investment professionals working from offices in 17 locations. In employing Templeton’s ground-up investment approach, our local analysts are able to address such issues because they not only understand the local languages and culture, but they get to know the companies and the market environment by meeting with company management teams, understanding the impact of local regulations, and talking with local customers and competitors. Frontier market investing often requires additional time and due diligence to assess the quality of the management team including more frequent on site visits to evaluate the business effectively.

Which countries and sectors in frontier markets look interesting?

We do not favor any particular market but select stocks which are the most attractive across all markets. A look at the breakdown of our frontier market funds country investments will show where we are finding the most bargains at this stage. Currently, our largest exposures are to Nigeria, Saudi Arabia, Egypt, Vietnam, Kazakhstan, Qatar, Ukraine and Argentina. Liquidity is the key concern for most investors, so markets that are the most liquid could attract greater investment flows.

In terms of sectors, our focus has been on what we refer to as the two ‘Cs’: consumers and commodities. Middle class expansion and the deceleration of population growth has triggered rising per capita income and increasing demand for consumer products. This in turn has led to positive earnings growth outlook for consumer-related companies. We look for opportunities not only in areas related to consumer products, such as automobiles and retailing, but also consider services such as finance, banking and telecommunications. Commodities can offer another way to access the high growth trajectory of nations like China and India and take advantage of greater demand. We are look for companies that are strong producers of commodities such as oil, iron ore, aluminum, copper, nickel and platinum. While infrastructure development in emerging markets has led to continued demand for hard commodities, demand for soft commodities such as sugar, cocoa and select grains has also increased. Resource-rich countries in Latin America, too, are benefiting from increasing global demand.

How can investors get exposure frontier markets?

The best way for retail investors to get exposure to frontier markets is to purchase a frontier markets fund. We have two major frontier markets funds. The total assets in our frontier markets funds has grown to about US$1.5 billion, probably making us the largest frontier markets investor. Trying to invest directly for an individual market is simply not practical since access too many of the markets is complex and expensive for the individual.

And Here They Go For Round Two: CME Hikes Brent, Crude Margins By 25%, First Of Many Such Moves

Some brilliant Chicago-based exchange apparatchik just ask himself this simple question: "If it worked so well with silver, why not do it with crude?" The answer is here: the CME, as we predicted last week, just hiked initial and maintenance margins on Crude and Brent by 25%, as well as FX, and other petrochemicals. And, oh yes, this is prudent risk management, because while the CME kept margins flat when WTI was at $115, the massive spike from $97 to $102 is unbearably destabilizing. At this point one can only stand back and watch as the CME proceeds with hike after hike, in an absolute vacuum from the administration, which certainly had nothing to do with this decision. And really who cares: free capital markets died on March 18, 2009.

Link

The Stocks To Benefit Most from North America's Hottest New Gas Play: DEI, CQE, PD, TDG, TSI, CFW, FES

Some oil fields never die. In fact, some just get better with age.

Alberta's Duvernay shale may just be the best example yet.

It all has to do with the "shale revolution,” and how it's dramatically altering the energy landscape.

To be sure, large volumes of natural gas are being found in the least likely of places: Quebec, Michigan, even countries like Poland and Latvia.

That’s all well and good -- the world is finally cueing into the fact that cheap abundant natural gas will drive the global economy for decades to come.

Alberta has been a latecomer to the shale gas game, but that's about to change in a big way -- thanks to the emergence of the liquids-rich Duvernay play.

For weeks, speculation has been building that unknown buyers have been staking out a new shale play in Wild Rose Country, driving land prices at Crown mineral auctions to new heights. In fact the Alberta government took in $2.6 billion in the fiscal year ended March 31, which was an all-time high (but still far short of liquor, tobacco and video lottery).

Since last summer unknown bidders have paid as much as $35,000 a hectare for land (2.5 acres=1 hectare) in an area called Kaybob that normally sells for only a tenth as much. At an Alberta land sale in March unknown buyers put up the ridiculous sum of $107 million for a single parcel near Fox Creek, 260 km northwest of Edmonton, a sure sign that something is afoot in the hinterland.

This is Montney country, yes. But the sheer scale of the bids was enough to turn heads and set tongues wagging in the high skyscrapers of downtown Calgary. All that money for deeper rights down to the Devonian -- it could only be the Duvernay.

The Duvernay is noteworthy because it's the source rock for the original Leduc oil discovery in 1947. It's also a high-quality source rock for most of the crown jewel oil discoveries in Alberta over the decades, from the Swan Hills to the Keg River reefs.

It's the same rock that built an industry... a gift that keeps giving to this day.

The Duvernay is a spot-on, perfect example of a well-known play that could never be developed without the technologies we have today: the dynamic duo of hydraulic fracturing and horizontal drilling.

On April 19, Trilogy Energy Corp. (TSX-TET), along with partners Celtic Exploration Ltd. (TSX-CLT) and Yoho Resources Inc. (TSX-YO) announced test results from their second Duvernay joint venture well.

The results were quite strong -- 7.5 million cubic feet per day of gas. More important, the well yielded 75 barrels of liquid condensates and 56-degree API oil for every million cubic feet of gas, for some 1,250 barrels of oil equivalent per day.

If the crew at Canadian brokerage firm Peters & Co. was disappointed with the cost of the well -- $17.5 million including the fracs -- it was clearly impressed with the production numbers, especially the liquids content which amounts to more than 500 barrels a day alone (Do the match by multiplying by $100 a barrel). Peters thinks there are cost savings to be realized with full scale development, which is usually the case with these early stage plays.

In some ways, it could be the most important well drilled in Western Canada since the first Leduc discovery well in 1947. That's because the liquids, which are priced on an oil equivalent basis, are more than enough to make up for the relatively weak gas price.

Wellington West Capital Markets reports that the addition of those liquids effectively pushes the realized gas price up to $8 per mcf equivalent (mcfe), which is not bad at all, especially in the current market.

These are the kinds of numbers that draw attention of major players.

So it was hardly a surprise that Encana Corp. (TSX-ECA) came out the very next day and revealed itself as the mystery buyer of all those Duvernay rights, spending $300 million on land acquisition in the first quarter alone.

For a company like Encana -- North America's second-largest gas producer, the shift into liquids is a no-brainer after the haircut they took in the first quarter. As one of the most gas-levered companies on the planet, they have to do something.

And one look at the company's first quarter results tells the story: it barely broke even in the first three months of the year (thanks to effective hedging) compared to a $1.5 billion profit in the same period a year ago.

They're basically giving the gas away for free.

Encana CEO Randy Eresman practically said so much at the company's annual meeting in Calgary last week when he suggested the company could give away the gas and still make money on the liquids.

In that sense Duvernay is manna from heaven, and some serious good fortune for a trouble gas sector.

Plus, Alberta has a ready-made market for those liquids, which are used to dilute bitumen and heavy oil and make it flow through pipelines like the Keystone XL to the U.S. Those liquids have been in short supply in recent years, and there was even talk of importing them from offshore for use in the oil sands.

As I said, Encana shelled out $300 million on land acquisition, just in the first quarter.

It’s a big number considering there are only two published drill holes into the Duvernay – and neither one belongs to Encana.

The Duvernay is the hot new stealth play in western Canada.

Yes, it’s early stage, but Encana’s big purchase shows they believe it will be a highly profitable play – so profitable in fact, the big dog of Canadian gas could become a take-over target itself. As I mentioned, the Duvernay is the “source rock” where much of the oil in the Western Canadian Sedimentary Basin was formed – and then migrated upwards into the pools and traps that have been the discovered since the first Leduc well in Alberta in 1947.

Ironically, Encana quoted Trilogy’s test numbers as a benchmark of success even though it hasn’t drilled a single horizontal well into the play. In fact, it only has one vertical penetration to date, which it described as “encouraging.” Assuming of course, a company like Encana has enough clout to create “the economies of scale” needed to drive down costs. Indeed, it has shown it has plenty of muscle, even in a weak gas price environment, to do just that.

On a conference call to discuss its disappointing first quarter results, company officials raved that the Duvernay has the potential to be a “top quartile” shale play in North America.

Confidence or cockiness? Given Encana’s reputation as a low cost producer that has become a victim of its own success by unlocking tens of trillions of cubic feet of reserves, we’re going to say both. Let’s face it, they ARE a big part of the reason there’s so much gas around these days.

But what happens next is an investor’s dream. This could be a HUGE new play, like the Horn River in remote northeast B.C., but on a larger scale.

Except Duvernay isn’t northeast B.C. In the Duvernay area, we’re talking about good roads capable of carrying good crews and equipment to work each day. You can even get a good cup of coffee on the way there, and drive back home at night – no camps with extended absences from family. It’s a virtuous circle.

So here's the full tally:

• The Duvernay has an abundant and highly profitable natural gas liquids, to the point where Encana says it can give the regular dry gas away for free and still make money.

• There is lots of infrastructure in the area – pipelines, gas processing centres, and so forth.

• Several junior and intermediate producers already own dozens of sections each of Duvernay rights that haven’t been priced into their stocks yet (this is exactly what happened in the Cardium play in late 2009 and Alberta Bakken plays in mid-late 2010).

So which companies/stocks will likely benefit the most from the emerging Duvernay play?

Companies like Trilogy have been playing Kaybob and another area called Simonette for almost two decades. Almost by accident, it’s now the largest Duvernay land holder after Encana.

Trilogy is either going to become a big fish in a small pond or its going to get swallowed fast. Ditto for Celtic and Yoho, which might as well hang out the for sale sign and get it over with.

Other junior companies that could be ripe for the picking include Donnybrook Energy (DEI-TSXv) and Cequence Energy (CQE-TSX). Both juniors own more than three dozen net sections near where Encana bought a large acreage position for the Duvernay – Donnybrook is on both sides of Encana’s new package – Simonette to the west and BigStone to the east.

Even Encana has been rumored to be a takeover target for a super major like Shell, and its shares must look pretty cheap right at $30 or so, especially if it’s sitting on another Marcellus or Eagleford. Unlike Exxon, Shell has been sitting on the shale gas sidelines and it could be looking to make a move. Taking out Encana would probably be a $40-billion bite and undoubtedly one of the biggest corporate deals in Canadian history (hypothetically speaking, of course).

But it’s not just producers that stand to gain from a big shale discovery in Alberta. Considering this first well cost nearly $18 million to drill and complete, it’s a trickle down economy with all the attendant drilling, completion and transportation stocks having nowhere to go but up.

Even if producers can get the all-in well cost down to $15 million or even $10 million, all your favorite drilling stocks, Precision Drilling Corp. (TSX-PD), Trinidad Drilling (TSX-TDG), and Ensign Energy Services (TSX-TSI), are going to reap the benefits of this next drilling boom.

Along with all your pressure pumpers and frack masters, the Calfracs (TSX-CFW) and Flints (TSX-FES) of the world, whose pumper trucks are the key to making unconventional gas a viable proposition.

And unlike Quebec or New York, even the politicos will get on board this train.

Given that the Alberta government had the scare of its life when its ill-conceived royalty changes just about scared every rig out of the province three years ago, it isn’t eager to make the same mistake twice. The bean counters in Edmonton are probably toasting their good luck about the Duvernay now, because this is the kind of tide that raises all boats, including theirs.

The Duvernay is the gift that keeps on giving. Only now, it’s going to be giving directly to investor’s wallets.

By. Keith Schaefer

Is It Time to Buy Silver?

Unless you have been hiding under a rock, you probably know that silver has had a major correction over the past week. The precious metal plummeted about 30% from a high of almost $50 an ounce to less than $35 yesterday. This six-day drop is one of the largest since 1983.

Silver has given back just about all of its gains for the past month and some traders are thinking it might be time to get long. But before you run and buy silver, there are a couple things to consider.

Forces That Move Silver

The U.S. Dollar

There are many theories on why this sell-off is happening. Obviously, any real strength or even support in the U.S. dollar will generally be bearish for precious metals like gold and silver. This is mostly because the U.S. holds the largest stockpiles of these metals and they are traded in U.S. dollars globally. Even though gold is more of a recognized currency, they both have sensitivity to changes in the U.S. dollar's value.

The falling U.S. dollar has recently leveled out. That means we've seen a small correction in dollar-denominated commodities and metals overall. Earlier this week, the European and London central banks held their rates steady. The ECB also hinted that they may not raise their rates next month either. This is good news for the U.S. dollar.

The U.S. dollar traded higher late in the day yesterday and sent other dollar-sensitive commodities like oil and even stocks much lower on the day. Oil had its largest percentage drop in three years. If you don't believe that the dollar is in control here, think again...

For now, it seems that the U.S. dollar will continue to be relatively weak. The rally seems more like a short-term bump rather than a long-term trend. Current Federal Reserve policy puts general downward pressure on the U.S. dollar.

Gold/Silver Ratio

Then there is the historical ratio between gold and silver. A good "average" ratio of gold to silver is about 55, according to many experts. That means 1 oz. of gold should buy 55 oz. of silver. The gold premium is because there is much more silver on this Earth than gold. Even though silver has industrial uses beyond gold, there is a global desire, respect and currency reserve with gold that silver just does not have.

If that ratio gets extremely high, like 100, that means that silver is cheap relative to gold and may be a good value. If the number is low, silver may be getting overly expensive.

On April 28, the gold-silver ratio was about 30, relatively low. Now the ratio is back up around 43, still low, but not extreme. I'd like to see that ratio above 48 if I were thinking of buying.

Using current gold prices of $1,494, that means a drop in silver prices to $31.12 an ounce. Remember, though, that ratios are a two-way street. That means gold prices can climb, too, putting the ratio closer to its "good average."

(Sign up for Smart Investing Daily and let me and fellow editor Sara Nunnally simplify the market for you with our easy-to-understand articles.)

Technicals

Technical formations also play an important role in finding buy and sell points. Looking at iShares Silver Trust (SLV:NYSE), you can see the sharp sell-off on the right side of the chart. In my opinion, it seems that we are nearing a short-term bottom. The lower Bollinger band (gray area) was just broken yesterday, as prices dipped below the lowest level of the band. This is generally an indicator of an oversold condition just before a bounce.

I also would look to the 50% Fibonacci retracement line (dotted) of about $33 for support. (For more info on Fibonacci retracement lines, read this Smart Investing Daily article.) The danger here is the fact that we have broken below the 50-day moving average, which is not good for the bulls. To solidify a strong trend, I would like to see the price of SLV get above that 50-day moving average, at about $38.

You can't simply view the charts in a vacuum. There are other things "manipulating" the market.

iShares Silver Trust
View Larger Chart

Margin Requirements

The manipulation here is the recent 500% jump in margin requirements for silver futures. When you buy a futures contract on silver (one futures contract is for 5,000 ounces of silver), you are required to put up a deposit called "margin." That initial cost has risen tremendously as of late. They have also raised the amount of margin you have to pay once you are already in the trade and it starts to go against you.

If traders cannot meet the new margin requirements, they are forced to sell their contracts. This new rule will deter new buyers.

It's like someone raising your rent from $1,000 to $5,000 in a month. Higher margin requirements can also make a sell-off worse, as contracts are sold to cover losing positions. These requirements affect everyone from individual traders to hedge funds. This is one of the main reasons why silver is making 10% moves daily.

Now in all fairness, the dollar cost of margin will rise as the price of silver rises, but the CME (COMEX) has increased the margin requirements abnormally in the past week and will raise them again Monday.

May traders are selling ahead of this hike.

ETFs

ETFs like the SLV hold actual silver and futures contracts. At present there are about 600 million ounces of silver held by ETFs. When traders begin to sell shares of an ETF like SLV, the ETF may sell silver futures to keep everything in balance. About 6 million ounces of silver have exited ETFs in the past week.

ETFs can also add to the domino effect, both long and short. But remember that stocks usually take the escalator up and the elevator down!

Once the hype settles down and the CME completes its margin increase on Monday, we should see silver prices stabilize. From my perspective, I see $33 as a level I may cautiously begin to buy. If silver breaks below that level, I think support will be around $29 until the Fed decides it's time to cool inflation.

I am sure that Ben B. was feeling quite happy with the corrections in gold, oil and silver this week. Perhaps Americans will feel some reprieve as well...

Editor's Note: Silver ETFs may be taking a big hit with these margin increases, but they're not the only way to play silver right now. Michael Robinson, editor of 180 Trader, has been riding the silver bull, and this most recent drop might give his subscribers another great opportunity. For more information on silver and the companies Michael's been recommending, check out 180 Trader.

Monday, May 9, 2011

Lindsey Williams : Gold going to $3000/oz and Silver to $75/oz - $100/oz

Lindsey Williams : The name of the game is control , one American out of three is on government payroll and totally dependent on the government , one in six Americans is on some form of government assistance in America , there are 300 million Americans living in America today , fifty millions are on medicare , fifty out of 300 , 45 million people are on food stamps , one third of America is being supported by the government in one form or another , they get some sort of paycheck from the government whether it is social security or medicare , one in six Americans gets money from the government in some form on the government payroll

The 20 year Japanese bear market in real estate is making its way to the United States. Home prices in the U.S. are now in a double-dip and have gone

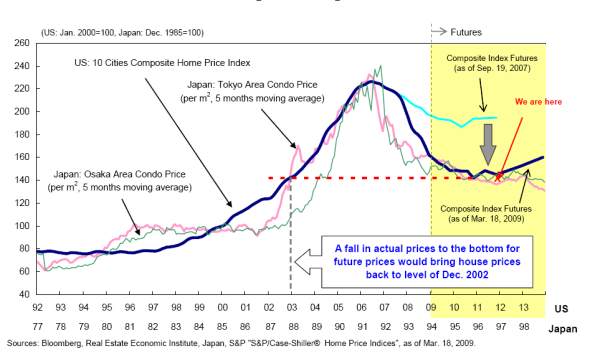
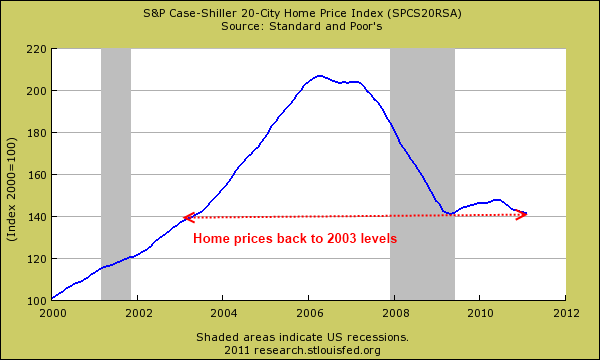
What if real estate prices remain the same for another decade? As I look at economic trends in our nation including the jobs we are adding, it is becoming more apparent that we may be entering a time when low wage jobs dominate and home prices remain sluggish for a decade moving forward. Why would this occur? No one has a crystal ball but looking at the Federal Reserve’squantitative easing program, growth of lower paying jobs, baby boomers retiring, and the massive amount of excess housing inventory we start to see why Japan’s post-bubble real estate market is very likely to occur in the United States. It is probably useful to mention that the Case-Shiller 20 City Index has already hit the rewind button to 2003 and many metro areas have already surpassed the lost decade mark in prices. This is the aftermath of a bubble. Prices cannot go back to previous peaks because those summits never reflected an economic reality that was sustainable. A chart comparing both Japan and U.S. housing markets would be useful here.

Will the U.S. have 20 years of stagnant home prices?

japan and us home prices

Source: Pragmatic Capitalism

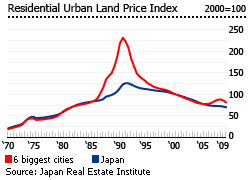
This chart does a simple comparison of Osaka condo and Tokyo condo prices which does not reflect the entirety of the Japanese housing market. Yet the path seems very similar. Large areas with a real estate frenzy that hit high peaks and have struggled ever since. In fact, if we look at nationwide prices we realize that Japan has seen a 20 year bear market in real estate:

japan real estate land prices

Japan urban land prices are back to levels last seen in the 1980s. You have to ask if there are parallels to our current condition. The first point we all have to agree on is that both economies had extraordinarily large real estate bubbles. For the United States the answer to this assumption is a big yes. We can run off a check list of how our real estate markets run similarities:

-Massive real estate bubble (check)

-Central bank bailing out banks (check)

-Bailed out banks keep bad real estate loans on their books at inflated values (check)

-Government taking on higher and higher levels of debt relative to GDP (check)

-Employment situation stabilizes with less secure labor force (check)

-Home prices remain stagnant (check)

Now the similarities are closely aligned in terms of banking policy. Our Federal Reserve followed a more aggressive path than Japan in bailing out our large banks. Yet all this did was make the too big to fail even bigger and exacerbated underlying issues in our economy. Four full years into the crisis and we are still dealing with a massive amount of shadow inventory. Remember the initial days when the talk was about working through the backlog of properties in a clean and efficient manner? Whatever happened to that? Banks operate through balance sheet accounting and it has made more sense to pretend the shadow inventory has somehow maintained peak prices while chasing other financial bubbles in other sectors. Not a hard way to make money when you can borrow from the Fed for virtually zero percent.

Japan and U.S. see real estate as poor investments

Our earlier assumption about the double-dip real estate recessions has now materialized through home price measures:

case shiller 20 city

The above chart may not seem like a big deal to some but keep in mind the United States had never witnessed a year over year drop in nationwide home prices since the Great Depression. Not only has that been surpassed but home prices are now back to levels last seen 8 years ago. The lost decade is now nipping at our heels but what about two lost decades like Japan?

comparing-housing-bubbles-debtdeflation

Source: Debt Watch Blog

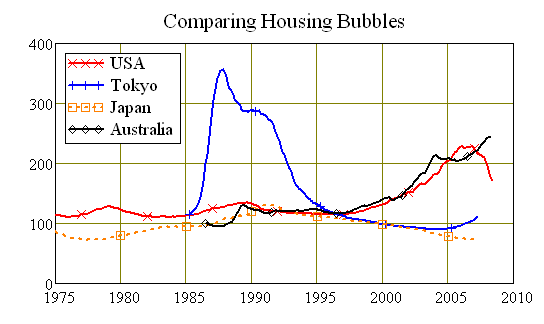
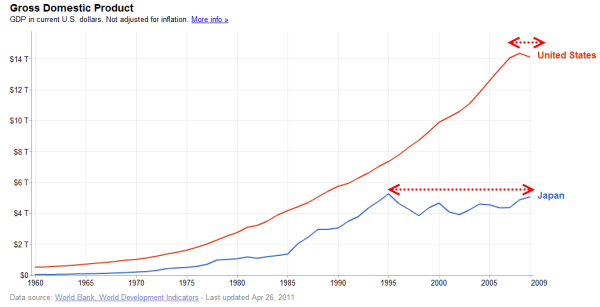
For some this may seem outrageous even to consider. The way I see it is that Japan was quickly catching up U.S. GDP in 1995 and many thought that it would at some point surpass our GDP. This was solidly the number two global economy for many years until China took that place last year. Yet the real estate bust has really been a drag on the economy for years moving forward:

us japan gdp

Why has real estate been such a drag on the overall Japanese economy? First, Japan’s unemployment rate stabilized after these bubbles burst but it shifted to a large temporary or contract based employment economy. One third of Japanese workers operate under this new world. Relatively low security with employers and this has spiraled into lower income and money to finance home purchases. The fact that the U.S. has such a large number of part-time workers and many of the new jobs being added are coming in lower paying sectors signifies that our economy is not supportive of the reasons that gave us solid home prices for many decades. I think this is a key point many in the real estate industry fail to emphasize. How can home prices remain inflated if incomes are moving lower?

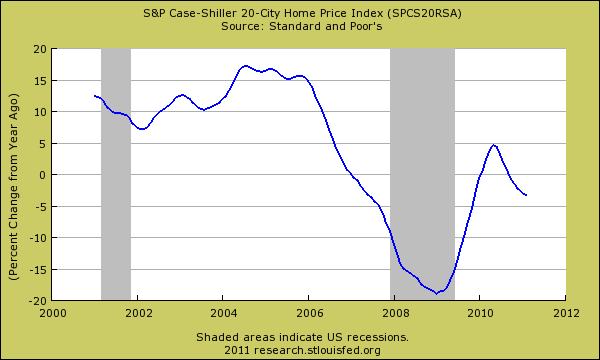
The question of affordability has always been at the center of this debate. Yet with government mortgages being the only option and banks now actually having to verify income Americans can only afford so much home when the gimmicks are removed like layers on an onion. This is why the double-dip is now fully here:

case shiller percent change

How much further will home prices fall? It can be that nationwide they fall only slightly more but in the end a lost decade is in the books. Two lost decades might be a real possibility given our demographic trends especially with baby boomers moving forward.

Massive inflation or stagnation moving forward?

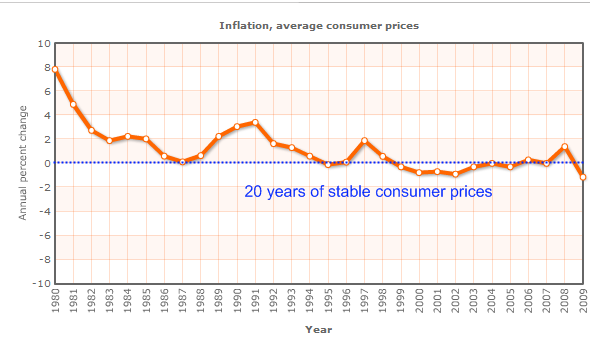
One would think that with all the Bank of Japan bailout measures for the banks and government spending that inflation would run rampant in the Japanese economy. That was never the case:
japan-inflation

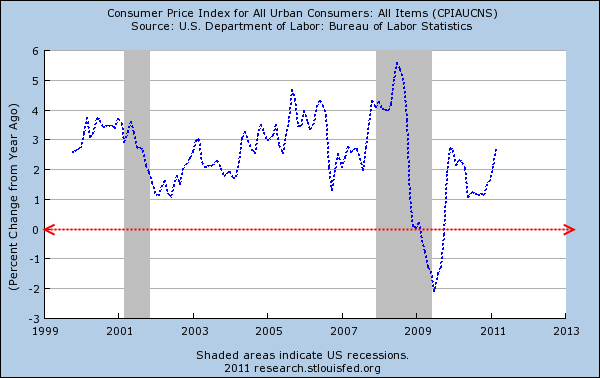
Now it is clear that at least by the above reported data, Japanese inflation has been virtually non-existent for the good part of 20 years. How does this compare with the U.S.?
us inflation

It is interesting to note that most of our inflation is coming from items ex-housing. As I have discussed the BLS does an interesting measure of home prices via the owner’s equivalent of rent. The reality is the above year over year changes in inflation in the U.S. are not coming from home prices.

Psychological aspects

Watching some of the global news I was seeing many young Japanese workers, some in their late 20s or early 30s, already resigned that they would never buy a home. They asked a young professional if he ever planned to buy a home and his response was (paraphrased):

“I don’t ever plan to buy. I saw my mother and father lose their marriage over trying to pay for the home payment for years. That was many of the big fights in our family. In the end we lost the home and I feel I lost my family. Why would I put pressure on myself for something like that?”

The millions of people that have lost their home and will lose their home are probably in households with children in many cases. Some may be in college and looking to buy in ten years. The notion that housing is always a great investment runs counter to what they saw in their lives. Will they even want to buy as many baby boomers put their larger homes on the market to downsize? Will they clear out the shadow inventory glut? Now I’m not sure how things are in Japan but many of our young households here are now coming out with massive amounts of student loan debt.

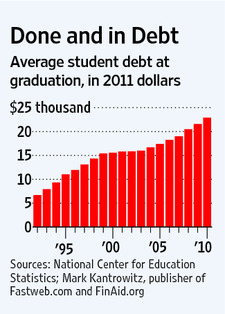
It was interesting to see the Wall Street Journal coming out recently with an article stating that the Class of 2011 will be the most indebted ever:

done and in debt

“(WSJ) The Class of 2011 will graduate this spring from America’s colleges and universities with a dubious distinction: the most indebted ever.

Even as the average U.S. household pares down its debts, the new degree-holders who represent the country’s best hope for future prosperity are headed in the opposite direction. With tuition rising at an annual rate of about 5% and cash-strapped parents less able to help, the mean student-debt burden at graduation will reach nearly $18,000 this year, estimates Mark Kantrowitz, publisher of student-aid websites Fastweb.comand FinAid.org. Together with loans parents take on to finance their children’s college educations — loans that the students often pay themselves – the estimate comes to about $22,900. That’s 8% more than last year and, in inflation-adjusted terms, 47% more than a decade ago.”

Lower incomes, more debt, and less job security. What this translated to in Japan was stagnant homeprices for 20 full years. We are nearing our 10 year bear market anniversary in real estate so another 10 is not impossible. What can change this? Higher median household incomes across the nation but at a time when gas costs $4 a gallon, grocery prices are increasing, college tuition is in a bubble, and the financial system operates with no reform and exploits the bubble of the day, it is hard to see why Americans would be pushing home prices higher.