The stock market has a history of running higher in anticipation of earnings season. On the S&P 500, for instance, here are the annualized returns for the following periods since 1950:
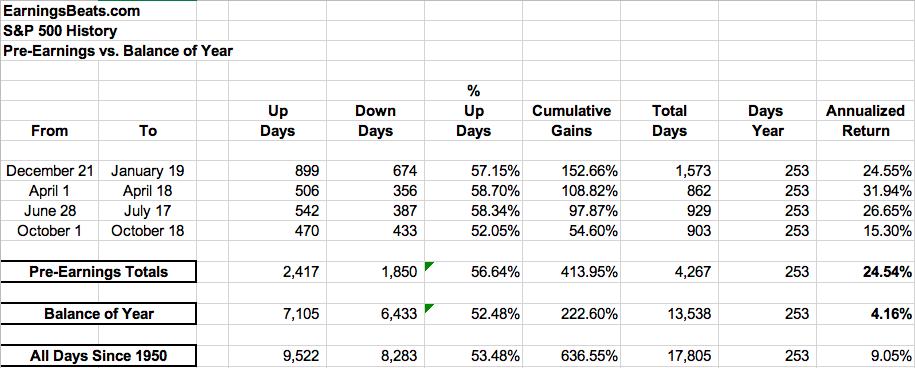
This is 71 years of daily data, which is certainly statistically relevant. I don't believe there's any question about what drives the stock market. Those two annualized returns in the far-right hand column couldn't be much more different. During pre-earnings runs, the S&P 500 has an annualized return of 24.54%. During ALL other times of the year, that annualized return falls to 4.16%. What do you think that does to options returns - if you're an options trader? On the long side, you've got a much, much stronger chance to make money during the periods identified above.
Not all companies report earnings early in earnings season, however. Those companies could very likely see their earnings runs later in the quarter, heading into their respective earnings reports. What companies report earnings in early June that could see their own earnings runs ahead of the report?https://stockcharts.com/articles/chartwatchers/2021/05/wall-street-doesnt-want-you-to-11.html
No comments:
Post a Comment