There is something important to keep in mind here: Consolidations tend to resolve themselves in the direction of the underlying trend. It’s not always the case (what is?), but more often than not, when an asset is trending: triangles, rectangles, flags, pennants, you you name it, these consolidations tend to breakout in the same direction they came from.
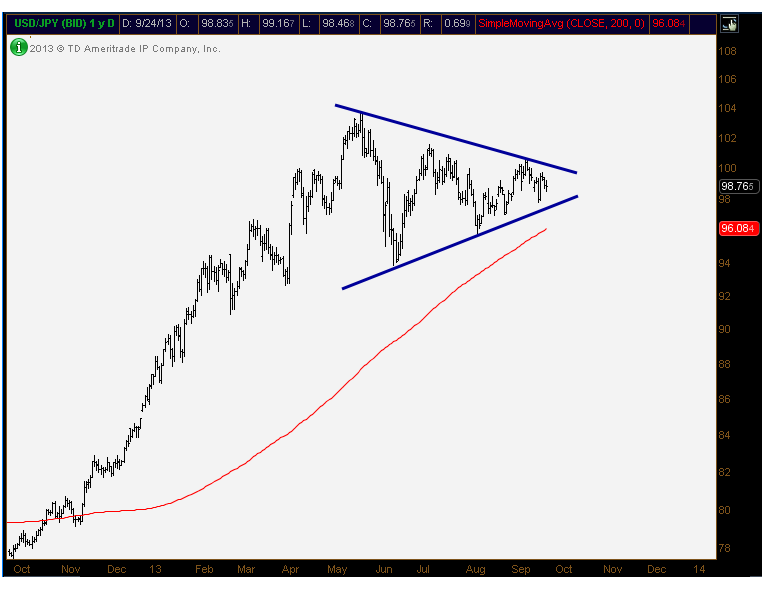
Today we’re looking at the Dollar/Yen $USDJPY. After a monster move from last Fall, the currency cross has been consolidating those gains in a text book range since the May highs. With lower highs and higher lows, we can see that the correction has taken the shape of a triangle made up of converging trendlines. Eventually, as prices approach the apex, something’s gotta give. I’m looking at 100.60 as confirmation of a new leg higher:
There is a very strong negative correlation between Japanese stocks and their currency. If you look at $DXJ, the Wisdomtree Japan Hedged Equity Fund, prices have already broken out of a similar looking triangular consolidation. And it looks like it’s heading higher, which is not good for Yen.
I think we could be looking at a new leg lower for Yen. We’ll be keeping a close eye on this chart above.
Please share this article
No comments:
Post a Comment