Saturday, January 31, 2015

Trading Tips from Legendary Millionaire Trader: Jesse Livermore

It’s 1929 and over the last 8 years the Dow average has seen an epic rise. Everyone wants to own stock, and loose leverage requirements allow it. Stock loans reach $8.5 billion; more money than was in U.S. circulation.  In September stocks start to flatten out, then decline. In spite of many people telling him it was foolish to short this raging bull market, Jesse Livermore begins to short stock, and continues to do so as the Great Stock Market Crash of 1929 unfolds. He profited to the tune of more than $100 million dollars…about $1.384 billion in 2014 dollars, according to the Bureau of Labor Statistics. This makes Jesse one of the most iconic legendary millionaire traders in history.
This wasn’t a hedge fund manager or someone who was trading other people’s money. Jesse worked on his own, and traded his own capital. Here are some trading tips Jesse Livermore provides in his book How to Trade in Stocks (1940), and the classic book which describes his earlier trading career: Reminiscences of  Stock Operator (1923).
Trading Tips from Legendary Millionaire Trader
There is nothing new in Wall Street. There can’t be because speculation is as old as the hills. Whatever happens in the stock market today has happened before and will happen again.”
While markets and trading technologies are constantly evolving and changing, the same patterns and emotional highs and lows continue to play out, causing some to get rich and others to lose. While most traders lose, and Jesse Livermore also had losing periods (discussed later), he established a trading system and tried to followed it. This allowed him to capture massive gains when the market trended in his direction, and also kept his risk limited if he was wrong. It was only when he deviated from this plan that it cost him money.
Here are some summary details about Jesse’s trading system:

“Only buy strong stocks in a bull market, and only short weak stocks in a bear market.”
  • Jesse Livermore was a trend trader. He focused on finding and buying the strongest stocks in a bull market, and shorting the weakest stocks in a bear market.
  • Don’t focus on too many stocks. Only focus on the strongest and/or weakest, as these are the ones moving the most and offering the most potential currently. Follow to many stocks and it’s hard to track and trade them effectively.
“It never was my thinking that made big money for me. It was always my sitting. Got that? My sitting tight!”
  • If there’s no clear signal to get in, don’t trade. Jesse traded at what he called “pivotal points,” which would be equivalent to a significant prior level in the stock. Until the price moved through that level, triggering a trade, he “sat tight.” This helped avoid drawing down capital when conditions weren’t ideal for trading.
“A loss never bothers me after I take it. I forget it overnight. But being wrong – not taking the loss – that is what does damage to the pocketbook and the soul.”
  • Jesse used stop loss orders to help control risk. He made trades based on his analysis and trade setups, but no one is right all the time. Jesse Livermore set a stop loss at a price which would get him out of the trade if the trade wasn’t working out. Sometimes that would mean getting stop out at a loss, only re-enter the position again when another trade setup came along. Adhering to the original plan of the trade is very important…take the loss when your trading plan dictates you should.
“When I am bearish and I [short] a stock, each sale must be at a lower level than the previous one. When I am buying, the reverse is true.”
“Each succeeding purchase must be at a higher price than the previous one.”
  • Livermore increased his position size in winning trades–called pyramiding. When a trade continued to move in his direction, this resulted in massive gains. Learn more about the pros and cons of pyramiding: How to Pyramid Your Trades.
Great numbers of people will buy a stock, let us say at 50, and two or three days later if they can buy it at 47 they are seized with the urge to average down by buying another hundred shares, making a price of 48.5 on all.
Having bought at 50 and being concerned over a three-point loss on a hundred shares, what rhyme or reason is there in adding another hundred shares and having the worry double when the price hits 44?
“The professional concerns himself with doing the right thing rather than making money, knowing that the profit takes care of itself if the other things are attended to.”
Final Word On the Millionaire Trader His System
Jesse Livermore’s system worked well for him, making him a millionaire trader when he followed it. Though the greatest enemy in trading is one’s self. Jesse failed to follow his system on many occasions, and since he wasn’t afraid to “swing a big line” of shares or futures contracts, when he deviated from him plan it often cost him dearly. While he made several fortunes, he was bankrupt or broke on a number of a occasions. Follow your plan, it’s what made you the money, and it’s also what will help you keep it.
By 1932 Livermore was divorced (for a second time), and remarried in 1933…to a woman who’s prior four husbands had all committed suicide (?!). Livermore would also take his own life in 1940, the same year his book How to Trade In Stocks was published. Nearly all of his massive gains had been eroded by 1932. Knowing his tendencies to deviate from his plan, earlier in his life he had set up trusts so his family would always have something. At his death, the trusts totaled about $5 million, equivalent to $84.55 million in 2014 dollars.
Please share this article

Canadian Dollar In For a Rough Ride – Tim Wood – January 29, 2015


Please share this article

The Shemitah: The Biblical Pattern Which Indicates That A Financial Collapse May Be Coming In 2015

by Michael Snyder, The Economic Collapse Blog:
Does a mystery that is 3,500 years old hold the key to what is going to happen to global financial markets in 2015?  Could it be possible that the timing of major financial crashes is not just a matter of coincidence?  In previous articles on my website, I have discussed some of the major economic and financial cycle theories and their proponents.  For example, in an article entitled “If Economic Cycle Theorists Are Correct, 2015 To 2020 Will Be Pure Hell For The United States“, I examined a number of economic cycle theories that seem to indicate that the second half of this decade is going to be a nightmare economically.  But the cycle that I am going to discuss in this article is a lot more controversial than any of those.  In his most recent book, Jonathan Cahn has demonstrated that almost all of the major financial crashes in U.S. history are very closely tied to a seven year pattern that we find in the Bible known as “the Shemitah”.  Since that book was released, I have been asked about this repeatedly during radio appearances.  So in this article I am going to attempt to explain what the Shemitah is, and what this Biblical pattern seems to indicate may happen in 2015.  If you are an atheist, an agnostic, or are generally skeptical by nature, this article might prove quite challenging for you.  I would ask that you withhold judgment until you have examined the evidence.  When I first heard about these things, I had to go verify the facts for myself, because they are truly extraordinary.
Read More…
Please share this article

Linear Technology Corporation (NASDAQ: LLTC)

Linear Technology Corporation designs, manufactures, and markets a line of analog integrated circuits (ICs) worldwide. It produces power management, data conversion, signal conditioning, radio frequency (RF), and interface ICs; µModule subsystems; and wireless sensor network products. The company’s products primarily include amplifiers, high speed amplifiers, voltage regulators and references, interface, data converters, battery stack monitors, silicon oscillators and Timer Blox, phase locked loop synthesizers and clock distribution, SmartMesh wireless sensor network systems, isolated µModule transceivers, RF circuits, power over Ethernet controllers, µModule power products, and signal chain µModule products. The company markets its products primarily through direct sales staff and electronics distributors.
Take a look at the 1-year chart of Linear (Nasdaq: LLTC) below with my added notations:
1-year chart of Linear (Nasdaq: LLTC)
LLTC had steadily declined from its $51 high in April clear down to $38 in October. Over a strong rally, the stock has created an obvious resistance at $47 (blue) over the last 2 months. A break above through $47 should mean higher prices for the stock.

The Tale of the Tape: LLTC has a key level of resistance at $47. A long trade could be entered on a break through that level. However, if you are bearish on the stock, a short trade could be made on any rallies up to $47.
Please share this article

Double your Money with these Oil ETFs Where will YOU Be when Oil Prices Soar?


I bailed once I saw the writing on the wall …
Oil fell below $80, and the static between the U.S. and Saudi Arabia was amplifying. Something sketchy was going on, and I wanted no part of it.
That's not to say I ran out and jumped on the short train. Although I wish I did. The VelocityShares 3x Inverse Crude Oil ETN (NYSE: DWTI) would've been one hell of a play. Could've turned $25,000 into more than $100,000 in about two months.
dwti
Now maybe that ship has not yet sailed. Some say we could float around $40 for the next six months.
I don't know if that's true or not, but I do know one thing …(more)
Please share this article

Chevron Slashes 23% Of PA Workforce As US Rig Count Collapses To June 2010 Lows

For the 8th week in a row (something that hasn't happened since June 2009), US total rig count plunged. This week's 90 rig drop to 1543 is the largest so far (with oil rigs down 94 to 1223 - lowest since Jan 2013).  The total rig count is now down 20% in the last 8 weeks to the lowest since June 2010 as it tracks the 4-month lagged oil price perfectly. This is the 2nd biggest 8-week drop in 22 years. This - rather unsurprisingly - has led Chevron to decide to cut 23% of its Pennsylvania workforce "due to activity levels." Not 'unambiguously positive' as so many in the central planning bureaus would have everyone believe.

The Rig Count continues to plunge along with lagged oil prices...


Obviously for oil prices to eventutally stabilize, production will have to slow and rig counts plunge further.. and so will jobs...

Charts: Bloomberg
Please share this article

The Year in VIX and Volatility (2014)

This is the seventh year in a row I have offered a retrospective look at the year in VIX and Volatility, which is my attempt to cram some of the highlights of the year in volatility onto one eye chart graphic with a (somewhat) manageable number of annotations.
In aggregate, 2014 was a very quiet year for the VIX, with a mean close of just 14.19 for the year, which is the lowest the VIX has been since 2006 and third lowest since 1995. On the other hand, as I recently documented, VIX spikes were common last year, with 2014 registering the third highest number of 20% VIX spikes since the beginning of VIX data, in 1990. In short, the VIX was susceptible to large spikes, but these were typically followed by strong mean-reverting declines. For example, the peak VIX of 31.06 on October 15 was the highest VIX reading since 2011, yet just six weeks later the VIX was back in the 11s. (more)

Please share this article

Friday, January 30, 2015

The Guerrilla Economist / 2015: Year of the Great Collapse


Please share this article

Man Who Predicted Collapse Of Euro Against Swiss Franc Issues Third Terrifying Warning To The World

from King World News
Today the man who 59 days ago remarkably predicted the collapse of the euro against the Swiss franc just issued a third terrifying warning to the world. This King World News interview takes a trip down the rabbit hole of massive chaos, panic and wealth destruction, as well as a frightening monster that has been unleashed on the world.
Egon von Greyerz: “Eric, as you know I’ve had a long-standing forecast — for over 10 years — that gold will reach $10,000 in today’s money. I’m also convinced that in the future the world won’t have anything resembling today’s money because of all the money printing that will take place as well as the accompanying hyperinflations….
Continue Reading at KingWorldNews.com…

Please share this article

Carter’s, Inc. (NYSE: CRI)

Carter’s, Inc. and its subsidiaries design, source, and market branded children’s wear under the Carter’s, Child of Mine, Just One You, Precious Firsts, OshKosh, and other brands. The company operates through five segments: Carter’s Wholesale, Carter’s Retail, OshKosh Retail, OshKosh Wholesale, and International.
Take a look at the 1-year chart of Carter (NYSE: CRI) with the added notations:
1-year chart of Carter (NYSE: CRI)
CRI has created a simple chart pattern known as a symmetrical triangle. Combining a down trending resistance (blue) with an up trending support (red) forms the triangle pattern. As the support and resistance converge on each other the pattern is created. Since there is no way to know which way the stock will break, most traders will wait for the breakout, or breakdown, before entering a trade.

The Tale of the Tape: CRI has formed a simple symmetrical triangle. A trader could enter a long position on a break above the down trending resistance (near $86) with a stop set under the entry level. However, if CRI were to break below the trend line support (currently at $83), a short trade could be entered with a stop above the trend line.
Please share this article

Either Oil Soars Back To $88, Or Energy Stocks Have To Tumble By Over 40%

Several days ago we showed something remarkable: “current forward 12-month P/E ratio for the Energy sector is now well above the three most recent historical averages: 5-year (12.0), 10-year (11.9), and 15-year (13.6). In fact, this week marked the first time the forward 12-month P/E for the Energy sector has been equal to (or above) 22.4 since April 8, 2002. On that date, the closing price of the Energy sector was 225.15 and the forward 12-month EPS estimate was $10.05.”

Further refining this analysis and using the S&P Energy Sector Index data, the sector’s forward multiple is now an absolutely ridiculous, mindblowing 23x, the highest since 2002, having soared by nearly 100% in just the past few months as a result of collapsing energy sector earnings.
READ MORE
Please share this article

Thursday, January 29, 2015

Is This Crisis About To Send The World Into Turmoil?


kingworldnews.com / January 28, 2015
As the crude oil market continues to struggle and worries about Europe intensify, today one of the legends in the business sent King World News a warning about a developing crisis that could send Europe and the world into turmoil.
Portion of Art Cashin’s note today: Greek Markets In Turmoil – Things in Athens continue borderline chaotic.  The Greek stock market is down the equivalent of 2500 Dow points since Friday.  Here’s a nice synopsis from my friend Peter Boockvar over at the Lindsey Group:
Any thought of pragmatism from the newly elected Greek government is quickly being thrown out the window. But, when you elect Marxists, this I guess is what you get. Greek capital markets are under major stress again today as they are losing faith that the negotiated process from here on with debts and budgets will go smoothly.
READ MORE
Please share this article

Copper cracks

As the bankers keep assuring the world that all is well–why are government bond yields nil to negative and central banks buying up dodgy debts all over the world then?–anyway, as the bankers push the ‘America is a self-sustaining engine of global growth’ meme, Dr. Copper appears to be cracking under the weight of weak demand. Today moving below $2.50 a pound, as it did last entering the 2009 recession, secular support lies some 40% lower in the $1.50/pound range.
Copper Jan 22 2015Please share this article

Microsoft Corporation (NASDAQ: MSFT)

Microsoft Corporation develops, licenses, markets, and supports software, services, and devices worldwide. The company’s Devices and Consumer (D&C) Licensing segment licenses Windows operating system and related software; Microsoft Office for consumers; and Windows Phone operating system. Its Computing and Gaming Hardware segment provides Xbox gaming and entertainment consoles and accessories, second-party and third-party video games, and Xbox Live subscriptions; surface devices and accessories; and Microsoft PC accessories. The company’s Phone Hardware segment offers Lumia Smartphones and other non-Lumia phones. Its D&C Other segment provides Windows Store, Xbox Live transactions, and Windows Phone Store; search advertising; display advertising; Office 365 Home and Office 365 Personal; first-party video games; and other consumer products and services, as well as operates retail stores. The company’s Commercial Licensing segments licenses server products, including Windows Server, Microsoft SQL Server, Visual Studio, System Center, and related Client Access Licenses (CALs); Windows Embedded; Windows operating system; Microsoft Office for business, including Office, Exchange, SharePoint, Lync, and related CALs; Microsoft Dynamics business solutions; and Skype. Its Commercial Other segment offers enterprise services, including premier support services and Microsoft consulting services; commercial cloud comprising Office 365 Commercial, other Microsoft Office online offerings, Dynamics CRM Online, and Microsoft Azure; and other commercial products and online services.
Take a look at the 1-year chart of Microsoft (Nasdaq: MSFT) below with my added notations:
1-year chart of Microsoft (Nasdaq: MSFT)
Over the last 2 months, MSFT has been consolidating between a couple of important price levels. First, MSFT has formed a clear support level at $45 (blue), which was also a key resistance last year. In addition, the stock has also been forming a down trending resistance level (red). These two levels combined have MSFT stuck within a common chart pattern known as a descending triangle that will eventually have to break one way or another.

The Tale of the Tape: MSFT is currently trading within a large descending triangle. A long trade could be made on a break above the down trending resistance or a pullback to $45 support. A short trade could be made on MSFT if the stock breaks below the $45 support level.
Please share this article

Gold Makes Reverse H&S Breakout, Gold Miners Bouncing Off Support


goldsilverworlds.com / January 27, 2015
By GoldStockTrades.com:
The Junior Gold Miners (GDXJ) ETF is bouncing off support at the 20 day moving average showing some bullish support and accumulation. Gold is holding the $1300 area showing a major January bounce which may forecast a powerful 2015. As the old saying on the market teaches, “As January goes, so goes the year.”

READ MORE
Please share this article

Wednesday, January 28, 2015

"Equities Will Be Devastated" Crispin Odey Warns, Looming Recession Will Be "Remembered For 100 Years"


"I think equity markets will get devastated," warns famed $12bn AUM hedge fund manager Crispin Odey in his latest letter to investors. Having been one of the biggest bulls of this particular central bank artificial-bull cycle, his dramatic bearish tilt (as we discussed what he thinks are the biggest risks underpriced by the market previously), is notable. Finally, Odey fears major economies are entering a recession that will be "remembered in a hundred years," adding that the "bearish opportunity" to short stocks looks as great as it was in 2007-2009 (more)

Please share this article

Profit From the 2015 ‘Dogs of the Dow’

A traditional Wall Street investing strategy that pops up every January is placing wagers on the “Dogs of the Dow.”
The tactic involves investing equal dollar amounts in the 10-highest yielding stocks in the Dow Jones Industrial Average and holding them until the end of the year.
The approach, including dividends, returned 10.8% last year. That was a hair better than the Dow’s 2014 gain of 10% (including dividends).  (more)

Please share this article

Gold Is on the Verge of a Major "Buy" Signal

Gold has been on fire.
 
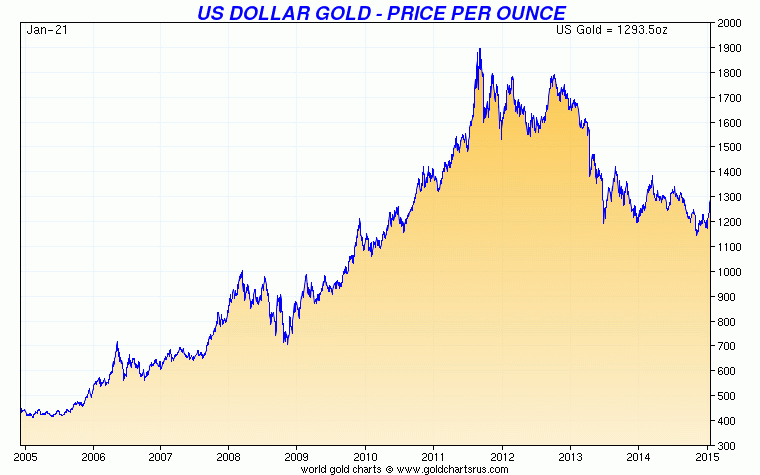
Over just the past four weeks, the price of gold is up $110 per ounce. That's a gain of almost 10%. It's one of the best monthly performances for the metal since the price peaked back in 2011.
 
If gold can hang onto these gains over the next week, we'll have the first long-term buy signal for the metal since mid-2009. And it could lead to big gains in the price of gold...
 
Take a look at this long-term monthly chart of gold with its Moving Average Convergence Divergence (MACD) momentum indicator... 
 
 
The MACD indicator is often used for determining overbought and oversold conditions. But it can be used as a long-term timing indicator, too.  (more)
Please share this article

Consolidation of US Stock Averages

Coming into 2015, the major US Stock Market Indexes like the Dow Industrial Average and S&P500 were not areas where we wanted to be putting new money to work. Not only did we have failed breakouts around the holidays which is always a bad sign, but I felt we needed some consolidation, or digestion, of the gains over the past few years. Markets can consolidate gains in one of two ways, either with a downside correction in price or sideways through time. The latter is obviously the healthier version of the two.
Today I want to take a look at a few of the Major US Stock Market Indexes to show how these averages have been consolidating over the past several months. The first one is the S&P500 representing 500 of the largest corporations in America. Look at price trading within these two converging trendlines and essentially at the same price that it was in early November:
1-27-15 spx
The next chart is the Dow Jones Industrial Average which includes 30 humongous US Stocks. Notice how similar this pattern is to the S&P500. Prices are right where they were in early November and trading within this symmetrical triangle looking formation defined by two converging trendlines:  (more)
Please share this article

2 Popular Investments Show Strength in a Sideways Market

All major U.S. indices closed in positive territory last week, led by the tech-heavy Nasdaq 100, which gained 3.3%. However, all others remain in negative territory for 2015 as stocks continue to drift sideways.
Although this recent sideways movement tends to lull investors to sleep, it is important and worth keeping a close eye on because it represents the probable springboard for the market's next multi-month trend. (more)


Please share this article

Tuesday, January 27, 2015

5 Trade Ideas : Stamps.com, KKR, CNOOC, Lear & Catamaran

CNOOC, Ticker: $CEO
ceo
CNOOC, $CEO, sold off with the Crude Oil decline, but began a consolidation process in December. It ended the week pressing against downtrending resistance and the 20 day SMA, unable to move over it. But the MACD and RSI are diverging higher. The RSI is making a new 4 month high as it moves over the mid line. Watch for price to follow higher.  (more)

Please share this article

It's Finally Time to Buy Gold Stocks

A safe-haven asset that has been left for dead in recent years is about to soar: gold.
 
One more Stansberry Research analyst just turned bullish on the precious metal...
 
 In the January 12 Digest, we explained why Stansberry Resource Report editor Matt Badiali is now bullish on junior mining stocks. He wrote...
 
We have a tremendous opportunity in junior miners today. As my colleague Dr. Steve Sjuggerud likes to say, they have the three hallmarks of a great contrarian trade... They're cheap, hated, and in an uptrend.

 Longtime readers know when junior miners rally, they soar... making investors five or 10 times their money.
 
 Then, in the January 15 Digest, we shared Stansberry Short Report editor Jeff Clark's research explaining gold's technical strength...
 
Gold stocks kicked off 2015 the same way they started 2014 – by breaking above resistance of both the nine-day exponential moving average (EMA) and the 50-day moving average (DMA).
 
Take a look at this chart of the Market Vectors Gold Miners Fund (GDX)...
 
 
The chart also shows a "bullish cross" of the nine-day EMA over the 50-DMA.

This is how strong gold-stock rallies begin.  (more)
Please share this article

Boardwalk Pipeline Partners, LP (NYSE: BWP)

Boardwalk Pipeline Partners, LP, through its subsidiaries, provides transportation, storage, gathering, and processing services for natural gas and natural gas liquids (NGLs). The company operates interstate natural gas and NGLs pipeline systems, including integrated storage facilities. Its pipeline systems contain approximately 14,195 miles of interconnected natural gas pipelines, directly serving customers in 13 states and indirectly serving customers throughout the northeastern and southeastern U.S. through various interconnections with unaffiliated pipelines. The company also owns approximately 255 miles of NGLs pipelines serving customers in Louisiana. In addition, it has underground storage caverns having aggregate capacity of approximately 207.0 billion cubic feet of working natural gas and 17.6 million barrels of NGLs.
Take a look at the 1-year chart of Boardwalk (NYSE: BWP) below with added notations:
1-year chart of Boardwalk (NYSE: BWP)
After a steady 5-month rally BWP dropped into October and has been trading sideways ever since. During the sideways move the stock has formed a common pattern known as a rectangle. A minimum of (2) successful tests of the support and (2) successful tests of the resistance will give you the pattern.
BWP’s rectangle pattern has formed an $18 resistance (red) and a $15 support (blue). At some point the stock will have to break one of the two levels.

The Tale of the Tape: BWP is trading within a rectangle pattern. The possible long positions on the stock would be either on a pullback to $15 or on a breakout above $18. The ideal short opportunities would be on either a break below $15 or on a rally back up to $18.
Please share this article

Buy Caterpillar (CAT), Collect Its Strong Dividend, Hold for the Long Term

Add caption
Industrial earth-moving giant Caterpillar (CAT - Get Report) saw its stock reach a new 52-week low of $83.05 recently as slower-than-expected global economic growth continues to pressure the stock.
Caterpillar, headquartered Peoria, Ill., makes diesel and natural gas engines and industrial gas turbines. This is in addition to its construction and mining equipment. These segments, while profitable, have struggled amid weak global economic environment, leading to 2% and 19% year-over-year declines, respectively in third-quarter Resource Industries revenue and Construction Industries revenue. (more)

Please share this article

Monday, January 26, 2015

3 Cheap Growth Stocks You Can Buy Right Now: Freeport-McMoRan (NYSE: FCX ), Silicon Motion Technology (NASDAQ: SIMO ), Alaska Air Group (NYSE: ALK )

With the stock market in nonstop rally mode over the past five years, an investor doesn't need to look far to uncover an abundance of growth stocks. But not all growth stocks are created equal. While some could still lead investors to extraordinary gains, others appear considerably overvalued and could wind up burdening investors with hefty losses.
What exactly is a growth stock? Though it's arbitrary, I'll define a growth stock as any company forecasted to grow profits by 10% per year or more over the next five years. To decide what's "cheap," I'll be using the PEG ratio, which compares a company's price-to-earnings ratio to its future growth rate. Any figure around or below one signals a cheap stock.
Here are three companies that fit the bill. (more)

Please share this article

BP plc (NYSE: BP) A Severely Beaten-Down Dividend Stock

Wall Street wisdom tells us not to try to catch a falling knife. Stocks in strong downtrends are more likely to keep falling than suddenly turn around. However, unless a stock is heading to zero, it will eventually find its footing.

That time seems to be at hand for international oil giant BP plc (NYSE: BP). (more)

Please share this article

NOW Inc (NYSE: DNOW)

NOW Inc. distributes energy and industrial products to upstream, midstream, downstream, and industrial markets in the United States, Canada, and internationally. The company’s products include pipes, valves and valve automations, fittings, mill and industrial supplies, tools, safety products, and artificial lift systems. It also provides supply chain management, project management, and e-commerce solutions. The company offers its products under the DistributionNOW and Wilson Export brand names. It serves oil and gas operators and drilling contractors, refineries, chemical companies, utilities, manufacturers, and engineering and construction companies.
Take a look at the 1-year chart of NOW (NYSE: DNOW) with the added notations:
1-year chart of NOW (NYSE: DNOW)
DNOW has been trending lower pretty much since the stock IPO’d last year. Over the last month or so, however, DNOW has been finding support at $22 (purple) whenever that price has been approached. Now that the stock is there again, traders should be able to expect some sort of bounce. However, if the $22 support were to break, much lower prices should follow.

The Tale of the Tape: DNOW has a key level of support at $22. A trader could enter a long position at $22 with a stop placed under the level. If the stock were to break below the support a short position could be entered instead.
Please share this article

Ride This Niche Stock's Steep Uptrend to Double-Digit Gains: Whole Foods Market (NASDAQ: WFM)

With the S&P 500 oscillating around the psychologically important 2,000 level, I remain cautiously optimistic about the market's outlook. In this uncertain environment, I'm looking to go long growth stocks that are outperforming the broader market.

One stock that has grabbed my attention is Whole Foods Market (NASDAQ: WFM). Since their October low near $36, shares have surged about 45%. In comparison, the S&P 500 has advanced about 10% during this period. (more)

Please share this article

Daily Chart Analysis of The Big Three: E-Mini, Gold, Crude Oil

I'm not talking about Ford, General Motors and Chrysler, but the commodity contract giants:  the S&P 500, Gold, and Crude Oil.   
As we begin 2015, there are plenty of opinions on this year's potential stock index futures  returns. The median forecast is for around a 15% gain this year. Well let's technically analyze this market on a daily basis and come up with an objective strategy!
The following is an update of the current technical condition for the big three.
Daily March E-Mini Futures
 
Gold futures have broken out to a five month high. From a technical point of view there appears to be more left on the upside.
Daily April Gold Futures 


It seems that almost every day the headlines read Crude Oil down another 5%. Futures are down a whopping 52% from the June highs.  Every talking head on this planet is plastering the headlines with downside predictions....$40, $30, $20, $10....Do I see $5 anyone? It appears that the lower prices go for crude the more bearish analysts become. Keep in mind that as a general rule commentary follows price. Forget all that nonsense and let's use some common sense!  Below we have a monthly chart of Crude Oil prices.
Daily March Crude Oil Futures


Please share this article

US Weekly Economic Calendar

MONDAY, JAN. 26
None scheduled
TUESDAY,  JAN. 27
8:30 am Durable goods orders Dec. 0.2% -0.9%
9 am Case-Shiller home prices Nov. -- 4.6% y-o-y
10 am Consumer confidence index Jan. 96.0 92.6
10 am New home sales Dec. 453,000 438,000
WEDNESDAY, JAN. 28
2 pm FOMC announcement
THURSDAY, JAN. 29
8:30 am Weekly jobless claims Jan. 24
295,000 307,000
10 am Pending home sales Dec. -- 0.8%
FRIDAY, JAN. 30
8:30 am GDP Q4 3.2% 5.0%
8:30 am Employment cost index Q4 0.5% 0.8%
9:45 am Chicago PMI Jan. -- 58.3
9:55 am Consumer sentiment index Jan. 98.3 98.2
Please share this article

Saturday, January 24, 2015

How to Make Seven Figures a Year on Social Media: James Altucher

Branden Hampton's a master of making money on social media and today James and Claudia ask him to help them understand it.

First off, James asks him what his top four social media sites are today.

Hands down, Instagram is number one today, followed by Snapchat, Twitter, and then in fourth place, everyone's "necessary evil" – Facebook.

They dig into what it takes to make a living off of social media.

For all Branden's best ideas, listen here. He's extremely open and willing to share his best secrets. (click here for audio)

Please share this article

Swiss Franc Shock from McalvanyFinancial


Please share this article

These Oil Stocks Are Setting Up to Soar Triple Digits

Falling oil prices are hammering all types of oil stocks right now. But one type is suffering more than the rest...
 
Oil-drilling companies (the companies that provide drilling equipment and service crews to oil producers) are down an average of 55% over the past six months. And they just hit a historically low valuation.
 
But this could soon create a great opportunity for investors to make a lot of money.
 
Let me explain...(more)
Please share this article

AMC Networks Inc (NASDAQ: AMCX)

AMC Networks Inc. owns and operates various cable television’s brands delivering content to audiences, and a platform to distributors and advertisers in the United States and internationally. The National Networks segment owns four nationally distributed entertainment programming networks comprising AMC, a television network that focuses primarily on story-telling under Something More brand name, which comprises films that are licensed from various studios; WE tv, which showcases original and programming series, and feature films; IFC, a network that creates original comedies under Always On. Slightly Off brand name and offers films from various film distributors; and Sundance Channel, which showcases original scripted and unscripted programming series. The International and Other segment operates a network of 9 channels in 16 languages across 24 countries focusing primarily on AMC in Canada, and global versions of the Sundance Channel and WE tv brands.
Take a look at the 1-year chart of AMC (Nasdaq: AMCX) below with my added notations:
1-year chart of AMC (Nasdaq: AMCX)
Over the last 6 months the AMCX seems to have formed an inverse head and shoulders pattern (green). I have noted the head (H) and the shoulders (s) to make the pattern more visible. The stock’s neckline resistance is just under the $66 level (red). AMCX would confirm its H&S by breaking through the neckline.
Lastly, keep in mind that simple is usually better. Had I never pointed out this inverse H&S pattern, one would still think this stock was moving higher simply if it broke through the $66 resistance level. In short, whether you noticed the pattern or not, the trade would still be the same: On the break above $66.

The Tale of the Tape: AMCX has formed an inverse head & shoulders pattern. A long trade could be entered on a break through the $66 level, preferably on an increase in volume.
Please share this article

Sell this major silver producer: Coeur Mining, Inc. (TSX—CDE; NYSE--CDE)

Among U.S.-based mining companies that focus primarily on producing silver, Coeur Mining, Inc. (TSX—CDE; NYSE--CDE) is the largest. It is also a growing gold producer. As with other silver and gold producers, Coeur’s financial results and shares have tumbled in recent years, along with commodity prices.

Deutsche Bank analyst Jorge Beristain says the slumping price of silver, combined with Coeur’s rising debt load, are “concerning”. With a 12-month target price of $3—significantly below the current share price—he has a “sell” recommendation.

The analyst updated his model to take into account Coeur’s third quarter results, lower guidance for 2015 spending on exploration, and the revised plan for the Palmarejo mine in Mexico, which will reduce revenue by double-digits in both 2015 and 2016.

Mr. Beristain notes too that, with “no feasible growth project in the pipeline”, he expects production to remain flat over the next four years. As well, spot silver prices are currently well below the $18.46 an ounce he expects all-in sustaining costs to average over that period. As a result, he expects Coeur to swing to negative operating cash flow.
Please share this article

Volatility On The Rise As Gold Being Bid Along With Other Safe Havens

It is really no coincidence that volatility is on the rise in the markets, and that it comes slightly after the end of Quantitative Easing.
The VIX is a proxy for volatility, and its chart shows a structural rise over the last 4 months. The chart below indicates a pattern of “higher lows” towards the end of 2014. It all started with the sell off in October, when the VIX rose to a level not seen since the summer of 2012.
VIX_January_2015

Without any doubt, there is a correlation between the end of the extreme QE program of the U.S Fed, the collapse of oil and other commodities (think of Dr. Copper in the first place), and the rise of volatility in the markets. (more)

Please share this article

Gold Price: Bull Run Or Bear Trap?

Gold has been on an upward tear these last few sessions, suggesting that there is every possibility that a bull phase has begun for the monetary metal based on certain macro-economic factors. But does the current move portend a trend? Or is this just yet another one of those booby traps gold’s market puppeteers are now famous for?
Is gold going to climb into the near-$1,400 range before Jeffrey Currie proclaims “Short Gold!”, presaging an utterly reckless overnight sell-off of gold futures overnight in Tokyo?
short gold
On April 10, 2013, Jeffrey Currie, lead analysts at Goldman Sachs, was quoted in the Wall Street Journal with the highly manipulative “Goldman Sachs:Short Gold!” headline. (Click to link to that story on WSJ)
Or, is gold going to resume its relentless climb akin to the 2002 to 2011 period, where each year gold notched double digit gains? Will we actually see gold at $2,000? (more)

Please share this article

Friday, January 23, 2015

Man Who Predicted Collapse Of Euro Against Swiss Franc Makes Second Terrifying Prediction


kingworldnews.com / January 22, 2015
oday the man who 52 days ago remarkably predicted the collapse of the euro against the Swiss franc just issued a second terrifying prediction.  This King World News interview takes a trip down the rabbit hole of desperate central banks, massive losses and total global collapse.
Eric King:  “Egon, the ECB has just announced this 1.1 trillion euro package in a desperate attempt to fight off deflation.”

READ MORE
Please share this article

Gold Breaking Out Globally In All Currencies

goldbroker.com / Nick Laird /
As can be seen in the following charts gold is finishing off the bottoming phase & beginning to break out in many currencies.
Weak currencies like the RUB, JPY, AUD, CAD, EUR are showing gold at new highs or heading up to new highs.

READ MORE
Please share this article

Could These 2 Stocks Double in 2015? : Barrick Gold Corp. (TSX:ABX)(NYSE:ABX),Cameco Corporation (TSX:CCO)(NYSE:CCO)

Overall, 2014 was a good year for the markets, but there are some notable exceptions, particularly when it comes to commodities companies.
Barrick Gold Corp. (TSX:ABX)(NYSE:ABX), for one, is down about 23% over the past 52 weeks, and that includes the 26% it has gained since the start of 2015. Cameco Corporation (TSX:CCO)(NYSE:CCO) is another stock that has been battered over the past 52 weeks, declining 28.8%; 6% of those losses were experienced since the start of 2015.
If you want to make money investing you have to buy stocks when they are relatively low. Unfortunately, this is easier said than done. When stocks are under pressure, there is a reason for it, and this reason usually scares most investors off. While it is basically impossible to predict the low point for any stock, these two companies have a great near and longer-term picture, even though 2014 was a year that both these companies would rather forget. (more)

Please share this article

Energy Stocks: Where’s The Bottom?

Our Global Investment Strategy service argues against buying energy-related equities.
from BCA Research
[...] Based on price-to-book, price-to-earnings, and price-to-sales, the energy sector looks relatively cheap today compared with 2004 (the last time that real oil prices were at current levels). That said, the prospect of significant asset write-downs, negative earnings revisions, and lower sales all suggest that these valuation measures may present a misleading view of the underlying health of energy companies.
Continue Reading at Blog.BCAResearch.com…

Please share this article

The Ph.D.’s Guide to Avoiding Big Stock Market Losses

by Bill Bonner
Acting Man

It’s Tough to Make Predictions, Especially About the Future
Markets were closed in the US on Monday for Martin Luther King Jr. Day. So, today, we really are going to talk about stop losses.
Mathematician Dr. Richard Smith, who runs TradeStops.com, was kind enough to visit us in Nicaragua and allow us to buy him a drink or two. He explained how they worked. And he told us about how he’s made them work even better.
“The world is much more uncertain than people think,” began the man with a Ph.D. in the subject.
Continue Reading at Acting-Man.com…

Please share this article

Thursday, January 22, 2015

Canadian Recession Coming Up: Yield Curve Inverts Following Unexpected Rate Cut; Loonie at Six-Year Low


globaleconomicanalysis.blogspot.com / Mike “Mish” Shedlock / January 21, 2015
Currency wars pick up steam today with still more unexpected central bank actions. Please consider Canadian Central Bank Unexpectedly Lowers Interest Rates.
Canada’s dollar sank the most in more than three years after the central bank unexpectedly cut interest rates, saying crude oil’s collapse will slow inflation and weigh on the economy.
The currency reached the weakest level in almost six years after the Bank of Canada reduced economic forecasts and lowered the benchmark rate target to 0.75 percent, from 1 percent, where it’s been since 2010. Government bonds climbed, pushing yields on two-, 10- and 30-year debt to record lows. Crude, Canada’s biggest export, has tumbled more than 50 percent since June amid a global glut.
“They are taking pre-emptive steps,” Thomas Costerg, an economist at Standard Chartered Bank, said in a phone interview from New York. “If oil prices remain under pressure, you could potentially see further cuts. This was not expected, and it’s going to put pressure on the loonie.”
READ MORE
Please share this article

3 Great Stocks for a Volatile Market: Johnson & Johnson (NYSE: JNJ), Berkshire Hathaway (NYSE: BRK-A ), Phillip Morris International (NYSE: PM )

The stock market has not changed much in 2015, with the Dow Jones Industrial Average down 1.75% since the turn of this year. However, 100-plus point moves have been the rule rather than the exception. In just the past couple of weeks, the Dow has plunged 400 points, gained those points back, and then dropped and rallied again.

What are investors to do in the face of this kind of market volatility? We asked three of our analysts which stocks they prefer when the market becomes erratic, and here is what they had to say. (more)

Please share this article

Davos Oil Barons Eye $150 Crude as Investment Slump Incubates Future Crunch

Roller coaster move in prices is destructive for the oil industry and is leading to investment cuts that may store up serious trouble for the future
by Ambrose Evans-Pritchard
Telegraph.co.uk

Rampant speculation by hedge funds and a rare confluence of short-term shocks have driven the price of oil far below its natural clearing level, coiling the springs for a fresh spike this year that may catch markets badly off-guard once again.
“The price will rebound and we will go back to normal very soon,” said Abdullah Al-Badri, Opec’s veteran secretary-general. “Yes, there is an over-supply, but fundamentals don’t justify this 50pc fall in price.”
Experts from across the world – from both the West and the petro-powers – said the slump in fresh investment in 2015 is setting the stage for a much tighter balance of supply and demand, and possibly a fresh oil crunch.
Continue Reading at Telegraph.co.uk…

Please share this article

iRobot Corporation (NASDAQ: IRBT)

iRobot Corporation designs, develops, and markets robots for consumer, defense and security, telemedicine, and video collaboration markets worldwide. The company operates in two segments, Home Robots and Defense and Security Robots. It offers consumer products, including floor vacuuming and washing robots, floor sweeping robots, and pool and gutter cleaning robots. The company also provides defense and security products, such as ground robots comprising 510 PackBot line of small unmanned ground robots; the small unmanned ground vehicle multi-purpose ground robots; the 110 FirstLook small, light, and throwable robot; and the 710 Warrior multi-purpose robot for carrying heavy payloads. It markets its robots to consumers through chain stores and other national retailers, as well as through its on-line store; and to the U.S. military, and other government agencies.
Take a look at the 1-year chart of iRobot (Nasdaq: IRBT) with the added notations:
1-year chart of iRobot (Nasdaq: IRBT)
IRBT has been trending slightly lower over the last 12 months while repeatedly finding support at $30 (green) whenever that level has been approached. Now that the stock is almost there again, traders should be able to expect some sort of bounce. However, if the $30 support were to break, much lower prices should follow.

The Tale of the Tape: IRBT has a key level of support at $30. A trader could enter a long position at $30 with a stop placed under the level. If the stock were to break below the support a short position could be entered instead.
Please share this article

Andrew Hoffman – Central Banks Cowardly Go Where None Have Gone Before

from Financial Survival Network
WTF Wendsays With Andrew Hoffman. Listen to Andy discuss:
  • SNB announcement;
  • ECB announcement (leaked an hour ago);
  • BOJ announcement (this morning) – lack of credibility;
  • BOCananda surprise rate cut this morning;
  • FOMC meeting next week;
  • gold exploding in all currencies – near record in Yen – others to come;
  • plunging U.S./global interest rates – as ECB validates global QE to infinity;
  • and of course, today’s comedic “Manipulation Wednesday” action.
Click Here to Listen to the Audio
Please share this article

Wednesday, January 21, 2015

Martin Armstrong – Sovereign Debt Collapse Coming Later In 2015

from Financial Survival Network
We connected with Martin Armstrong today. The movie made about him, The Forecaster, is quickly becoming a European blockbuster. He’s hoping that it will become available in the States before too long. With the Swiss ending the Franc-Euro peg and the coming sovereign debt collapse, it’s all starting to move very quickly. The potential for the world to become a very unpleasant place is increasing by the day. The politicians seem to be more concerned about the next election than the long term well-being of the country. Start planning your defensive strategy now. Forget that pension you were promised, it’s probably not going to happen. There’s lots more in this timely interview.
Click Here to Listen to the Audio
Please share this article

Babcock & Wilcox Co (NYSE: BWC)

The Babcock & Wilcox Company operates as a specialty constructor of nuclear components for customers in the power and other steam-using industries. The company’s Power Generation segment designs, engineers, manufactures, supplies, constructs, and services utility and industrial power generation systems, including boilers used to generate steam in electric power plants, pulp and paper making, chemical and process applications, and other industrial uses. Its Nuclear Operations segment manufactures naval nuclear reactors for the U.S. Department of Energy/National Nuclear Security Administration’s Naval Nuclear Propulsion Program, which in turn supplies them to the U.S. Navy for use in submarines and aircraft carriers. The company’s Technical Services segment provides services to the U.S. Government comprising uranium processing, environmental site restoration services, and management and operating services for various U.S. Government-owned facilities. Its Nuclear Energy segment fabricates pressure vessels, reactors, steam generators, heat exchangers, and other auxiliary equipment.
Take a look at the 1-year chart of Babcock (NYSE: BWC) with the added notations:
1-year chart of Babcock (NYSE: BWC)
BWC has been trading mostly sideways since August of last year. In addition, the stock has found support at $27.50 (red) whenever that level has been approached. Now that the stock appears to be have broken that support, lower prices should follow.

The Tale of the Tape: BWC broke a key level of support at $27.50. A trader could enter a short position on any rallies up to or near $27.50 with a stop placed above the level. If the stock were to break back above the $27.50 level, a long position could be entered instead.
Please share this article

Franco-Nevada (NYSE: FNV), Still My No. 1 Gold Play

With the majority of the commodity markets suffering from a metaphorical case of seasonal depression, it’s important to look for the bright spots.
Surprisingly, gold is gaining momentum in the face of a stronger dollar and the threat of higher interest rates in the United States.
In fact, gold is one of the best-performing asset classes so far in 2015. It’s outperformed every major stock index and most international indexes! (more)

Please share this article

Eric Coffin: Is Market Sentiment Shifting to Gold?

by Kevin Michael Grace
The Gold Report


Equities past their peak? Bond market dead? So where do investors go looking for returns? Eric Coffin suggests gold, both bullion and stocks. In this interview with The Gold Report, the publisher of Hard Rock Analyst explains how changes in the currency and energy markets have reignited interest in the sector, and suggests five gold explorers, plus one each in copper and uranium, poised to profit from the new economic realities.
The Gold Report: Quite a few analysts believe 2015 will be a year of great economic volatility, as foreshadowed by what happened with oil in 2014. Do you agree?
Eric Coffin: I do think 2015 will be pretty volatile, with the potential for nasty financial surprises. We’ve already seen bond yields go negative in Germany, France and elsewhere, and we could see big moves in and out of different asset classes.
Continue Reading at TheAuReport.com…
Please share this article