Let’s begin with where this originally came from. The old saying is officially,
The inference here is that there’s no point owning stocks during the summer. The big boys won’t get back to business until Horse Racing season in England is over in the Fall. The British have been celebrating this day in September since the St. Leger Stakes (last leg of the English Triple Crown) was established in 1776. In America, we like to call this time of the year, “Football Season”.“Sell in May and go away. Stay away till St. Leger’s Day”
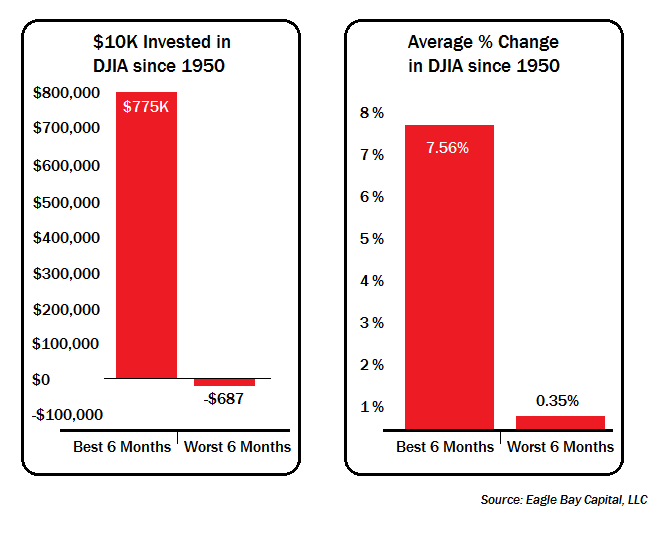
So should we listen? Does the math behind this make any sense? I think it does. If you use the Dow Jones Industrial Average and go back to 1950, the statistics are simply staggering. Hypothetically, had you invested $10,000 but only owned stocks between November 1st through April each year, on April 30th of 2013 that $10,000 would have been worth $775,055. That’s pretty awesome. Now, had you done the exact opposite and purchased the Dow Industrials every year on May 1 and sold on Halloween, you would have actually lost $687 over the past 63 years.
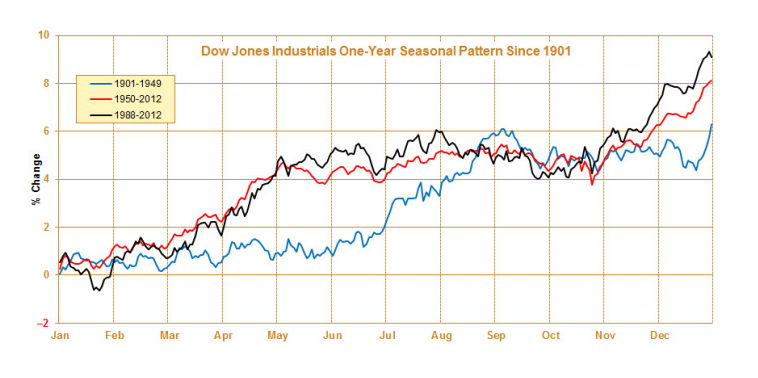
But it wasn’t always like this. In fact, before 1950 it was profitable to be a buyer in May. At the time, farming was the big driver of the US economy, so this made August the best month of the year from 1901-1950. Today, farming makes up less than 2% of the US Economy, so since 1987, August has actually been the second worst month of the year for the Dow and S&P.
Here is the one-year seasonal pattern from the Stock Traders Almanac. Look at the difference between the pre-1950 period compared with the behavioral patterns since then:

I’ve been bearish about US Stocks all year long. This is just another feather on the hat for the bears and I don’t see any reason to be optimistic about the US Stock Market Indexes. There will always be individual non-correlated names that do well; that won’t change. But as far as the market as a whole is concerned, I will continue to keep a bearish/neutral stance. At least for now.
Please share this article
No comments:
Post a Comment